Configure Log Levels for Services
While running your application, sometimes you need to output some information about the application behaviour in a certain way, this is called application logging. There are different detail levels of logging that you can configure based on the data you need. To configure your log level in the Workbench, this can be done across a whole project (Deployment target), for a certain service or for a component in your composed application.
Description
As described, application logging is a way of logging certain information about the application. This can be helpful in case of a failure in production. The log level indicates the level of information that is output. There are seven log levels, in hierarchy from most detailed to least; ALL, TRACE, DEBUG, INFO, WARN, ERROR, FATAL. Each indicates a different level of information to be output.
Please note that the links to the workbench tools in this tutorial only apply to the IBM Education Environment we provide. If you are using a different environment, e.g. your own installation, you will need to navigate directly to the required tools.
Precondition
- You have modelled your services and successfully run your deployment pipeline at least once.
Steps�
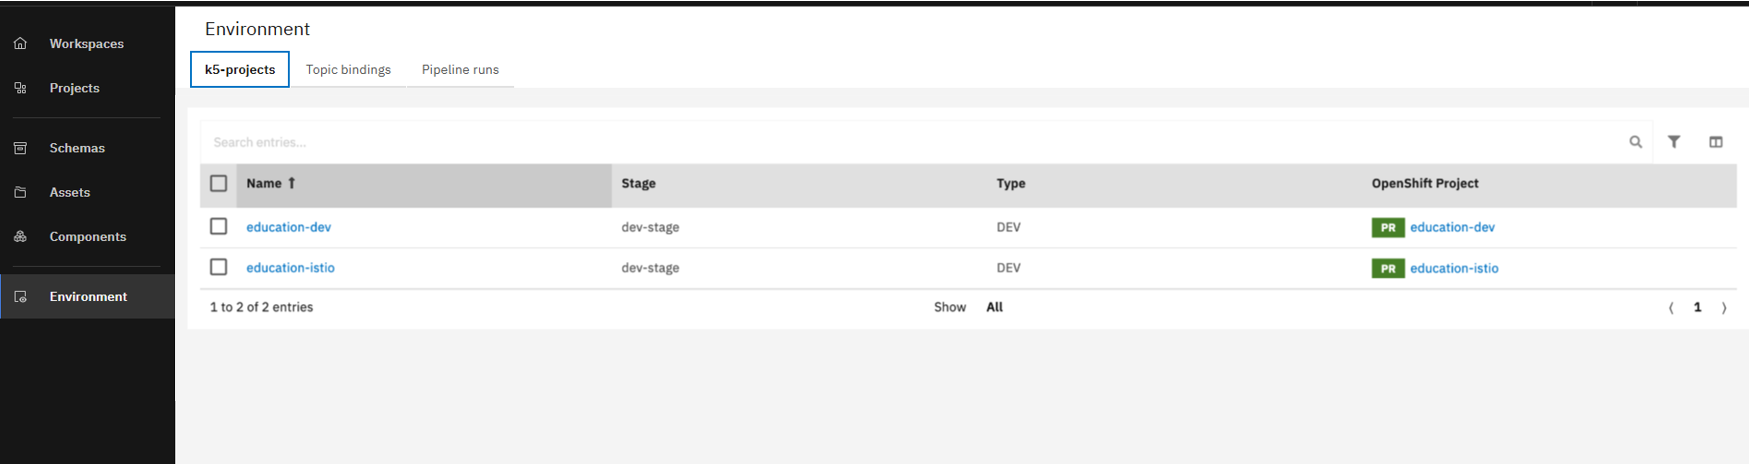
- Open the Environment page.
The Environment layer is the top-level view on all k5-projects. It provides overviews and managing capabilities around deployed services and applications.
-
Take a look at the table k5-projects. This is the place where all connected OpenShift projects are listed. You can find your deployment target in the list.
-
Click on the link to open your deployment target.
Now, that you have your deployment target open, you can configure log level across the whole project or for a certain service as follows.
Configure log level across your project
-
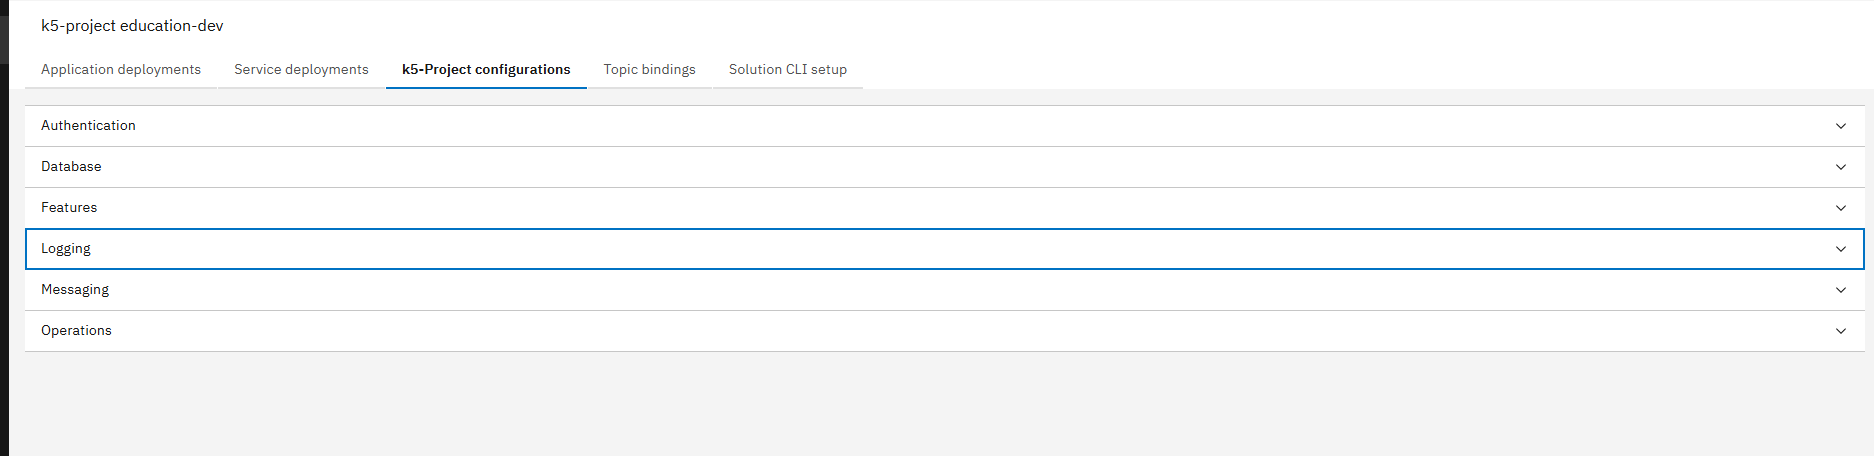
Click on k5-project Configurations tab.
-
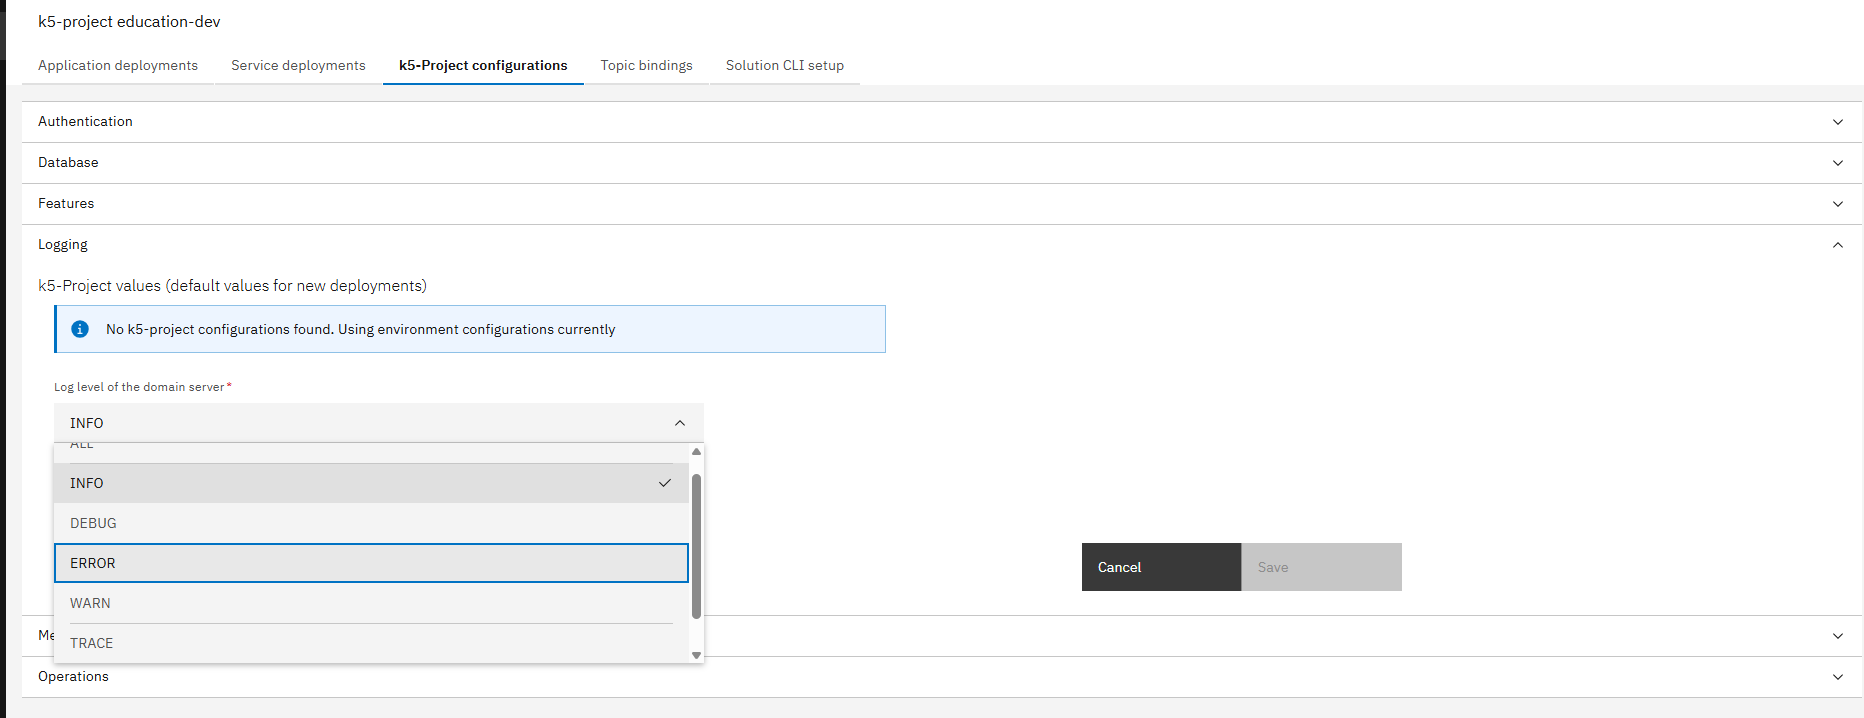
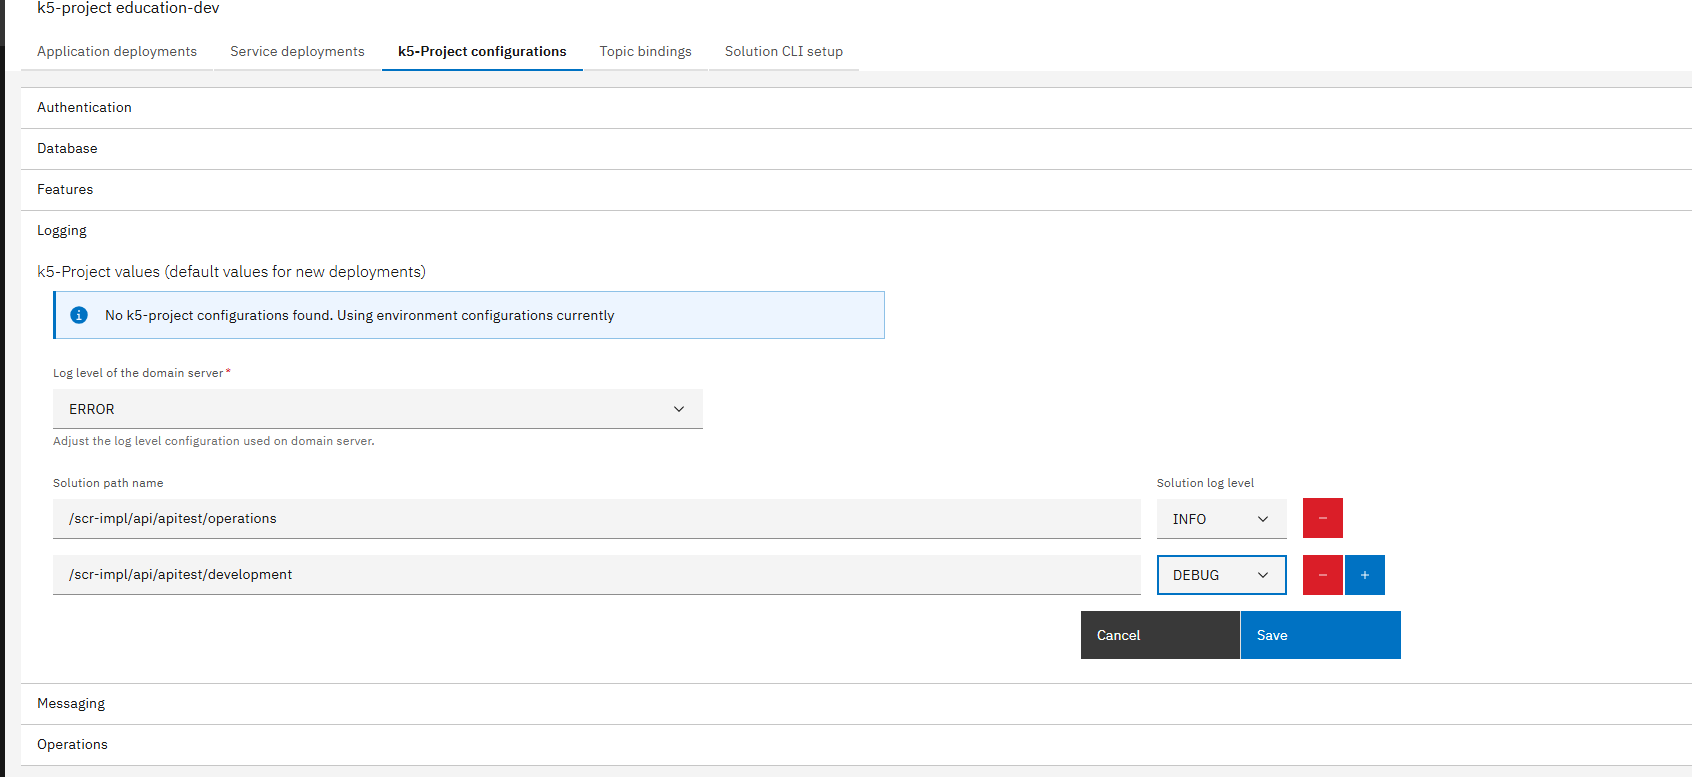
In the Logging dropdown, you can select the log level you want for the domain server
-
You can also type down your Solution Path Name and select the corresponding log level you want to configure. You can configure the log level as many solutions as you want at once by clicking on the add button and filling the configuration data.
Configure log level for a certain service
-
Click on Service Deployments tab.
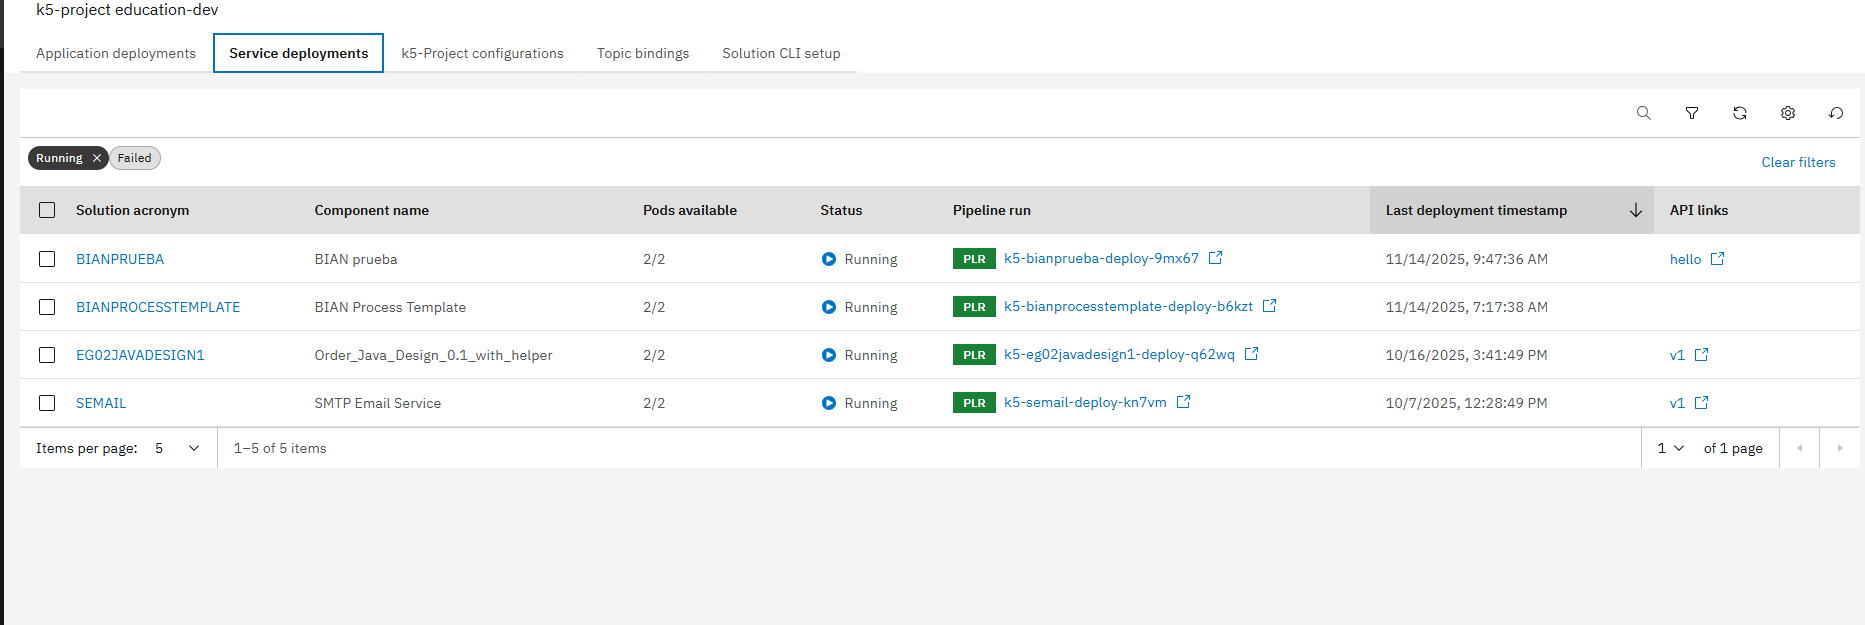
-
Select the service you want to configure log level for.
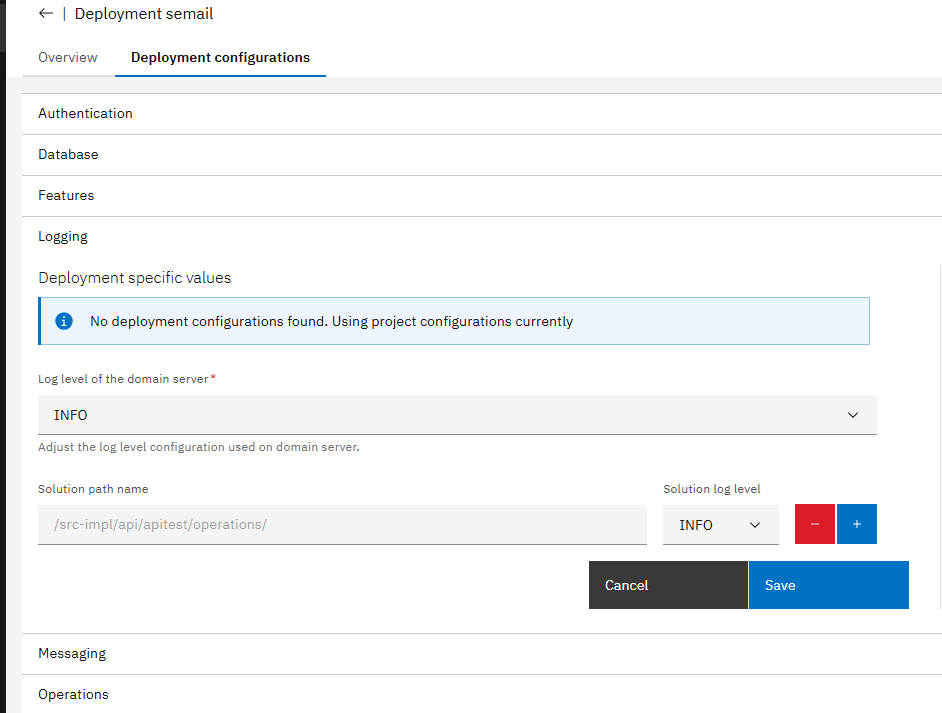
-
In the Logging dropdown, you can either select the log level you want for the domain server or you can type your Solution Path Name and select the corresponding log level you want to configure. You can configure the log level to one or many solutions at once by clicking on the add button and filling the configuration data.
Now you have successfully learned how to configure your log level accross different aspects within your project.