Perform Remote Debugging
To debug your Java Solution, you can debug them in a number of ways. JUnit is one of them, and using the docker images for the events locally is another method. For more info, please see here. With the IBM DevOps Solution Workbench, you are also able to debug your Java solutions remotely. This means that a Java service is running on e.g. OpenShift and you can connect and debug from your local IDE.
Description
This How-To will explain the steps to debug your Java services remotely based on the Product Documentation - Remote Debugging of Java Services.
Prerequisites
- An IDE (e.g., IntelliJ IDEA) configured for Java development.
- A port-forwarding CLI installed locally, such as
kubectloroc - A deployed Java service (single or in an application composition)
Steps
1. Configure the service for remote debugging
The deployed Java service has to be configured for remote debugging but is different dependent on the service's deployment as standalone or inside an application composition. For both options, the steps are shown below.
In general, this is the necessary configuration that has to be added to the deployed Java service:
remoteDebugging:
  enabled: true
autoscaling:
  enabled: false
replicaCount: 1
Besides this necessary configuration, you are also free to add optional configuration to the remoteDebugging setting
(the autoscaling and replicaCount setting remain the same) to customize the debugging behavior.
It is described in Product Documentation - Remote Debugging add optional Configuration.
If you are done with remote debugging, it is recommended to undo the changes you made for the configuration so that your deployed Java service has all capabilities enabled to deal with high traffic when used e.g. in production.
Inside an application composition project
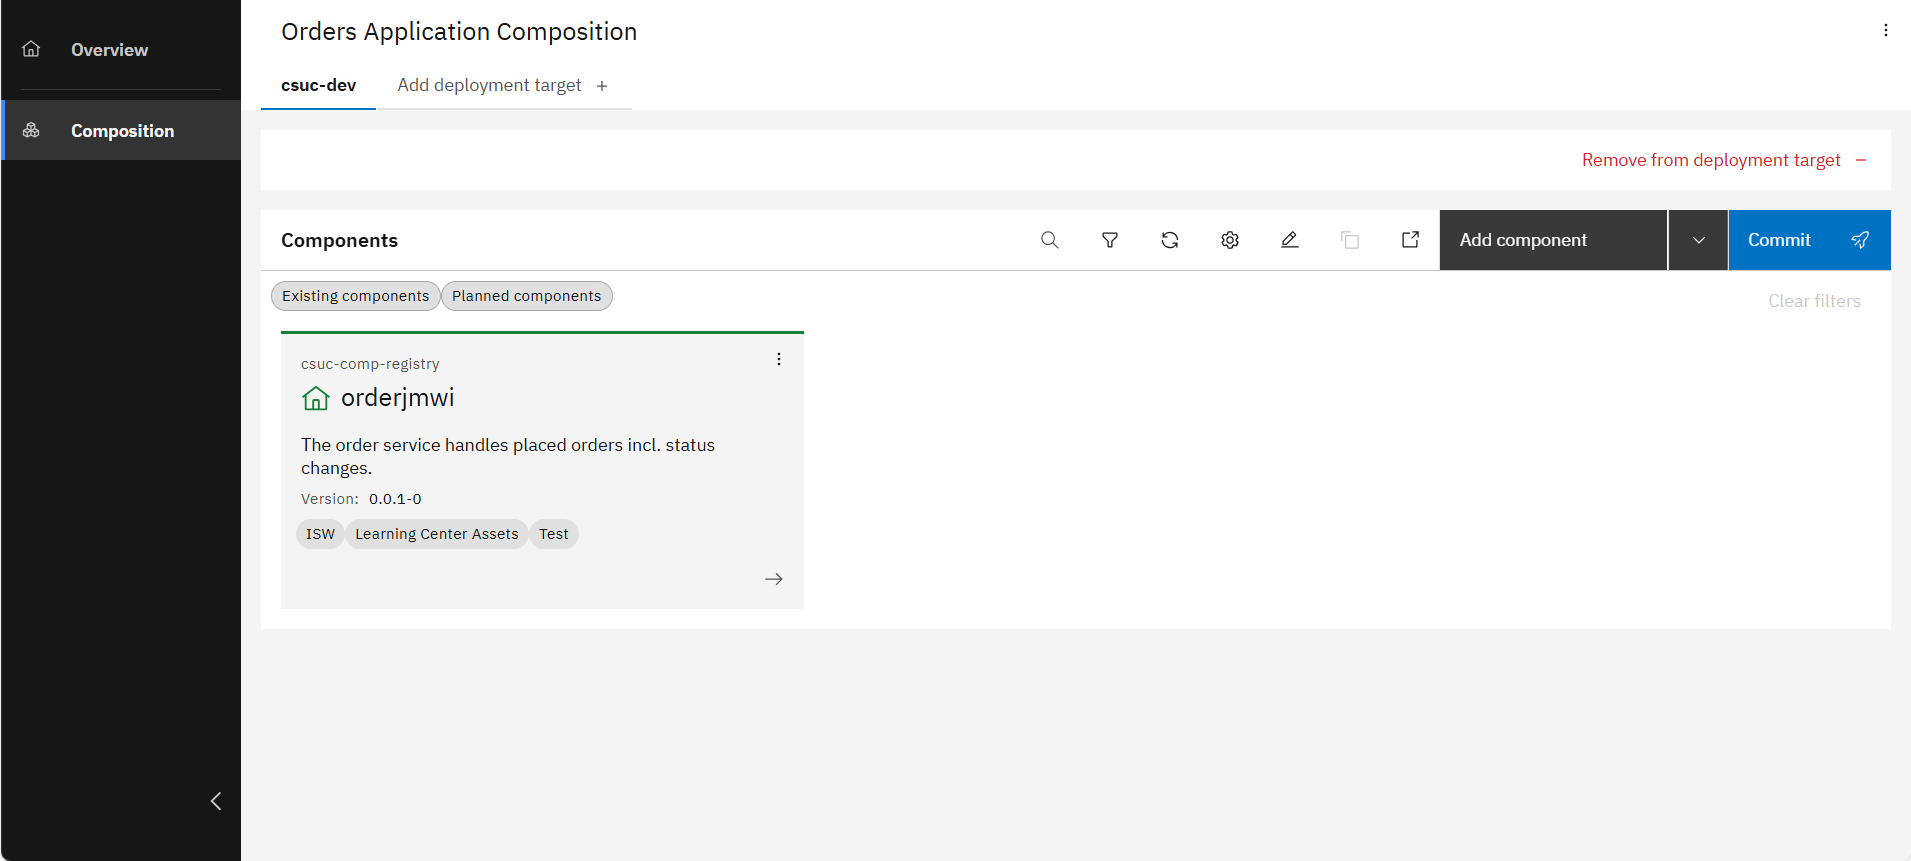
Inside an application composition project, open the "Composition" view, then click on the three dots on the top right corner of a component to open the service options.
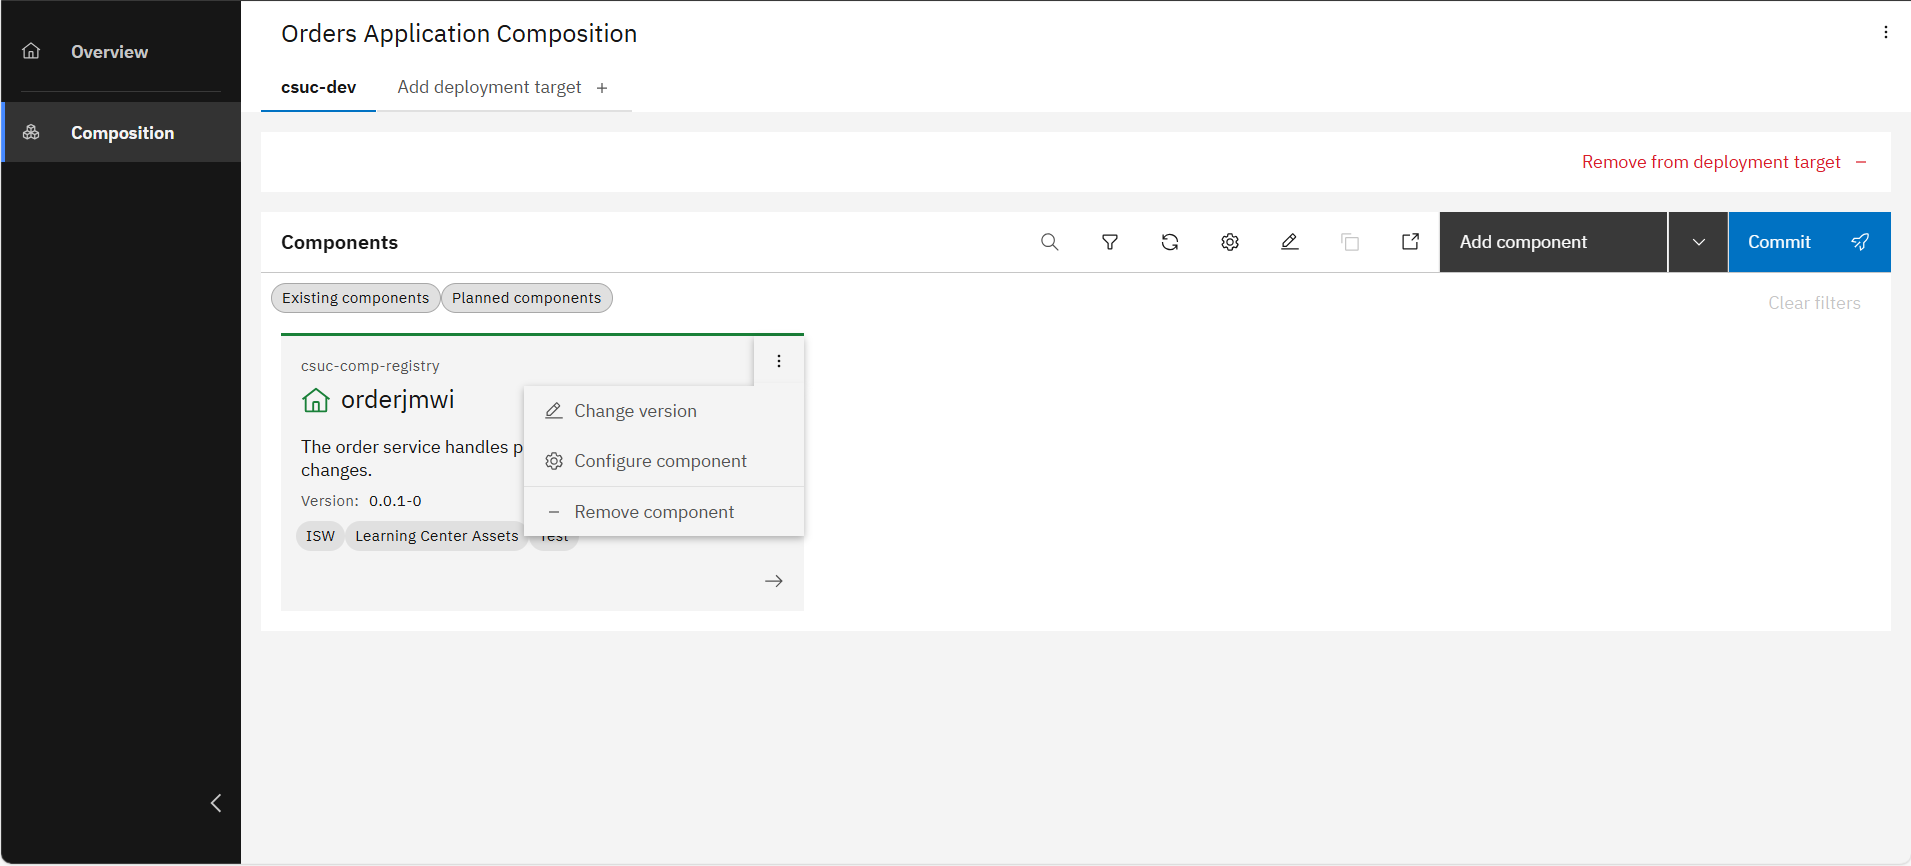
Then click on "Configue component" to open the configuration of the component.
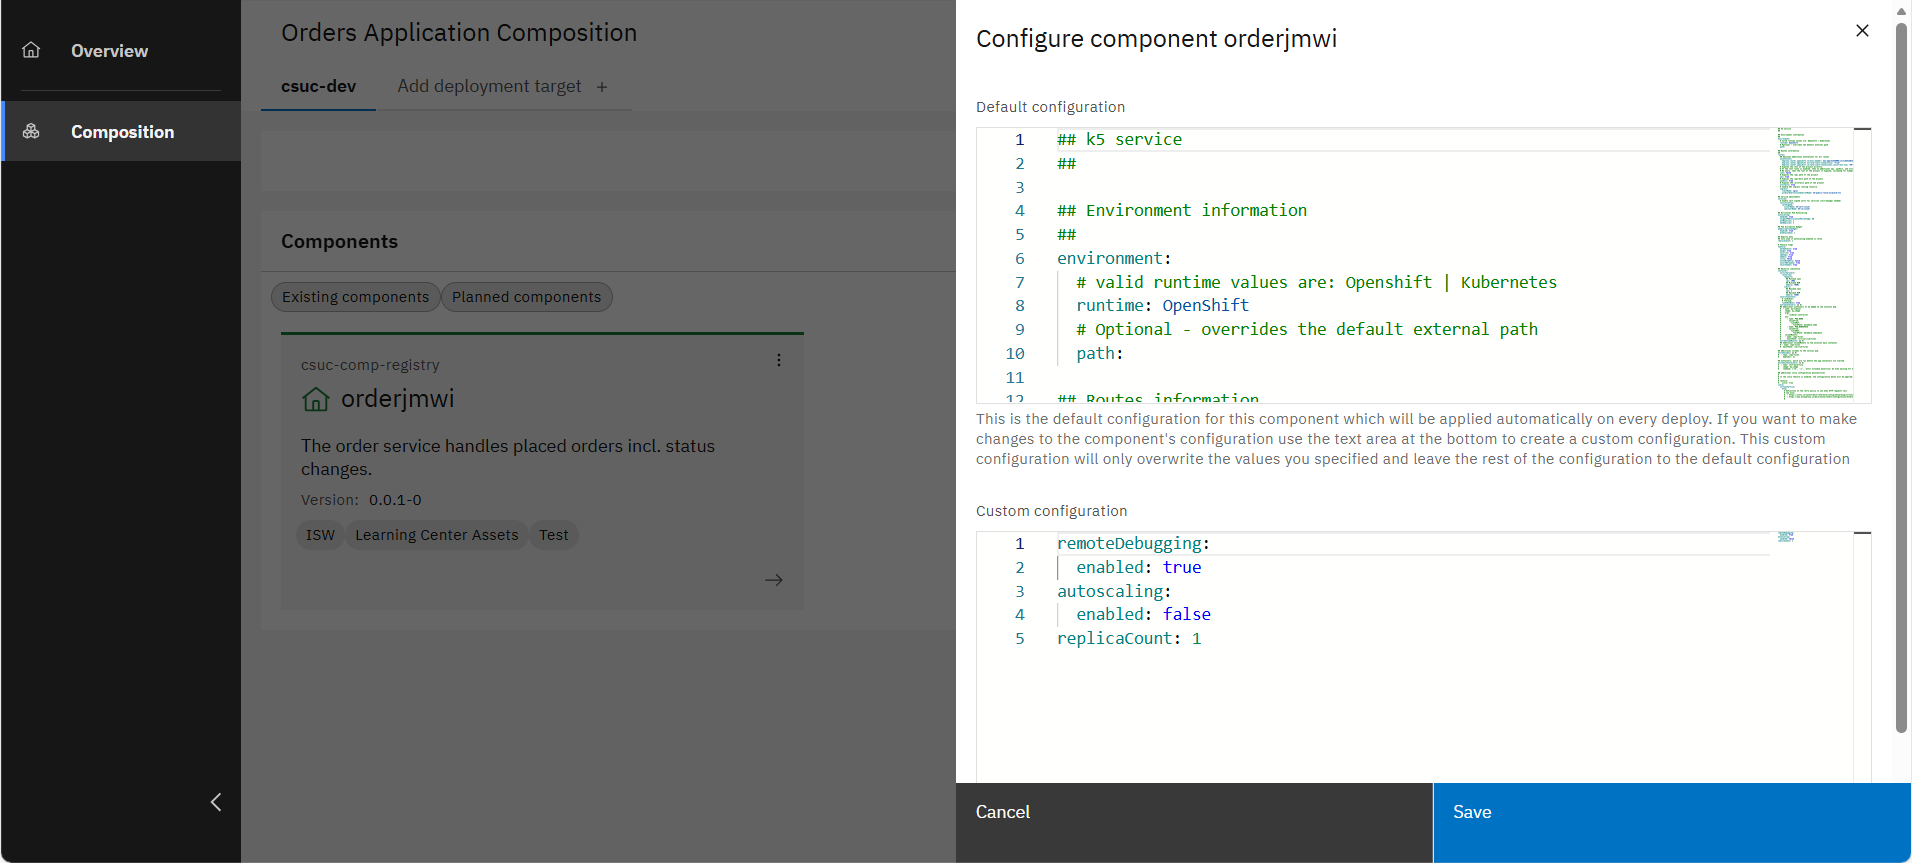
Add the configuration above to the custom configuration of the component.
Now click on "Commit" on the right side to trigger a re-deployment of the composition's components.
For a single deployment
-
For a single deployment, add the configuration above by directly using the Product Documentation - API Configuration Management.
E.g. use the following base pattern for the respective curl command to execute:
curl -X 'POST' \
'https://{configHostname}/api/cfg/v1/runtimes/{runtimeName}/solutions/{solutionAcronym}/configurations/{configurationName}' \
-H 'accept: */*' \
-H 'Authorization: Bearer {bearerToken}'\
-H 'Content-Type: text/plain' \
-d 'remoteDebugging:
      enabled: true
    autoscaling:
      enabled: false
    replicaCount: 1'
Parameters:
- configHostname: The hostname of the Configuration Management.
- runtimeName: The name Kubernetes namespace where the service is deployed, e.g.
dev-stage - solutionAcronym: The acronym of your Java project, e.g.
ORDERS - configurationName: The name of the configuration (its value has to be
ssob-sdo-values-yaml) - bearerToken: The token needed to execute authenticated API calls
💡tipIt is also possible to add the configuration via the Swagger UI of the Configuration Management API if accessible. In that case, the hostname and token are already provided for this API.
If using OpenShift for your IBM DevOps Solution Workbench instance, you can find the API via the OpenShift web console or the CLI. Therefore, you need the following information:
The OpenShift project/namespace where the IBM DevOps Solution Workbench is installed (e.g.workbench-tools)Inside this namespace, search for a route with the name
k5-configuration-managementand extract and access the respective url in a browser. Then the Swagger UI of the Configuration Management API should be visible. -
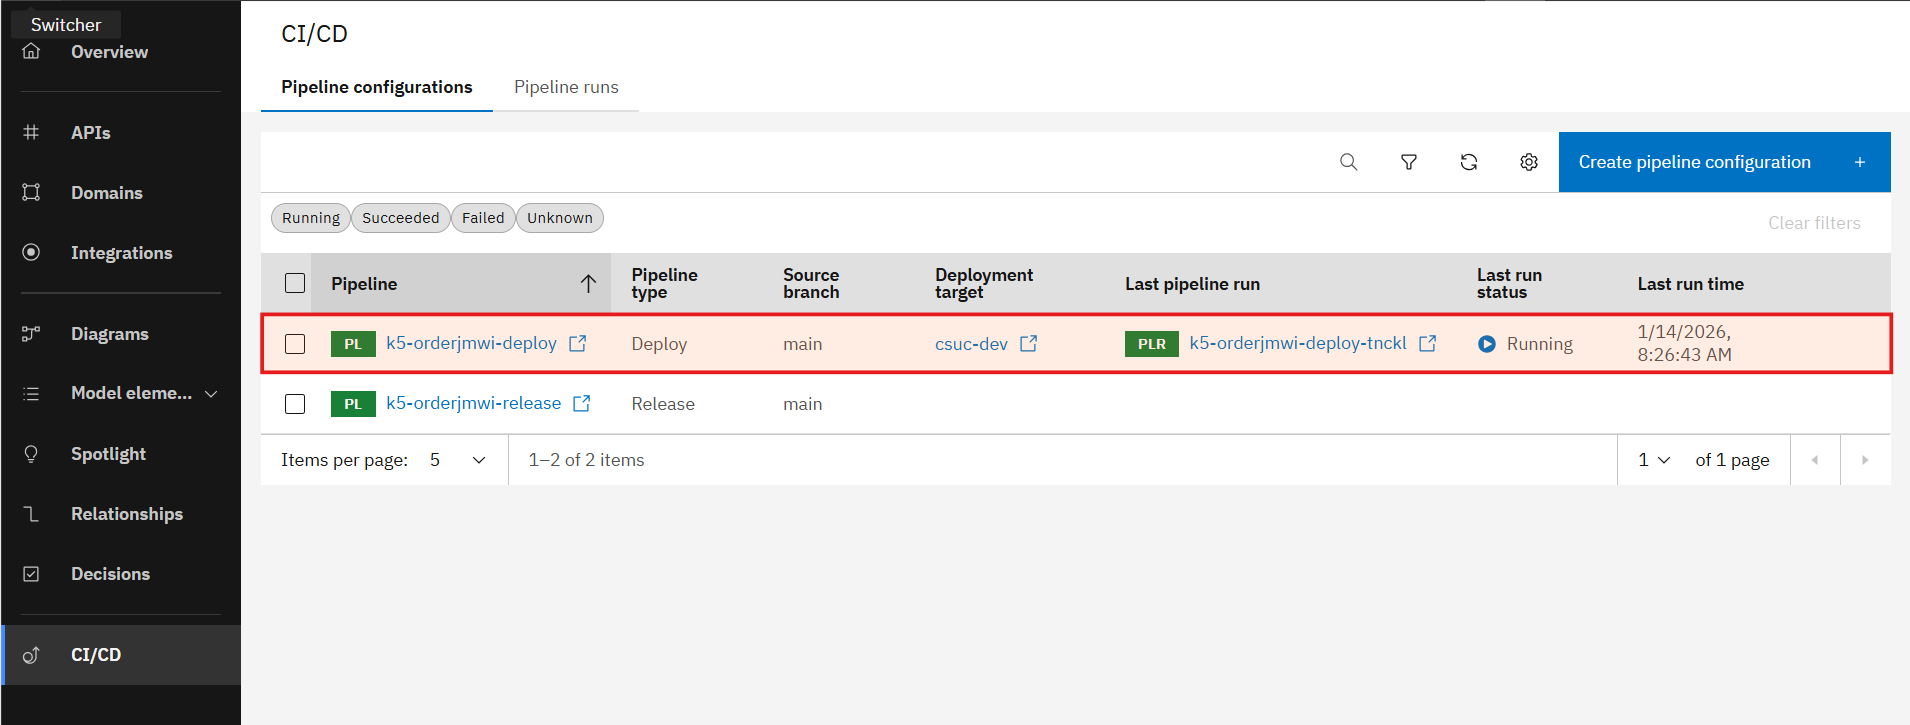
Open your Java project in the Solution Designer and re-deploy your service inside the "CI/CD" section.
2. Clone and build the project locally
Open the respective project in the Solution Designer.
If you have not setup your local development environment before, please follow the instructions here.
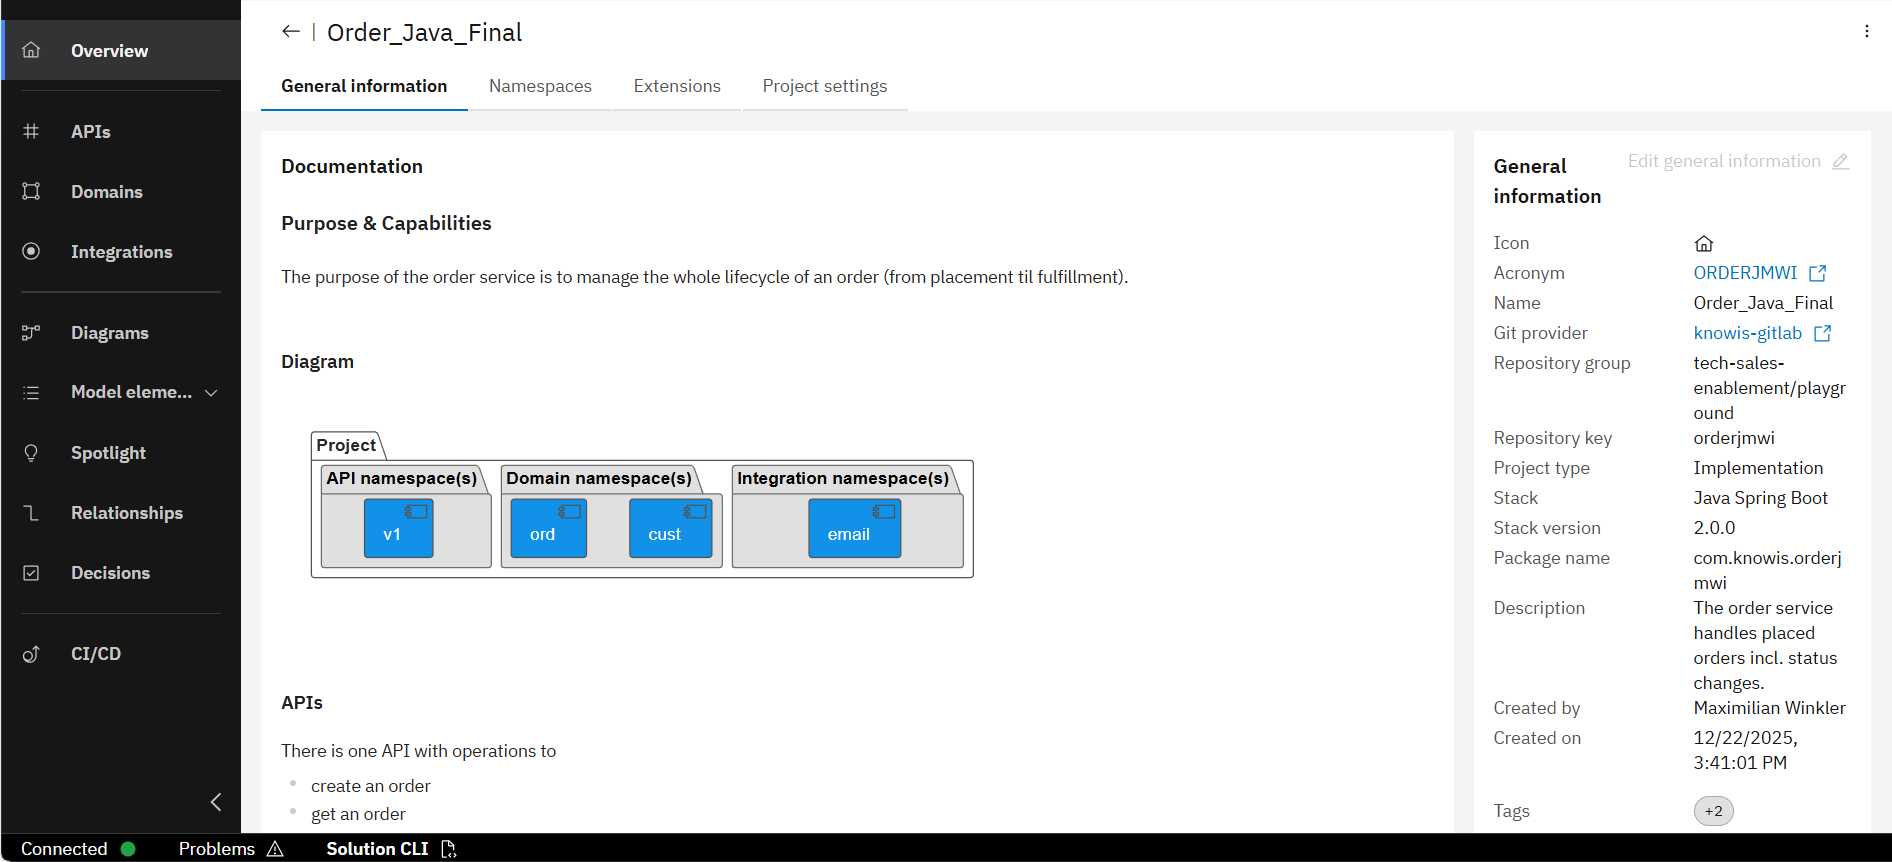
Click on "Solution CLI" on the bottom left.
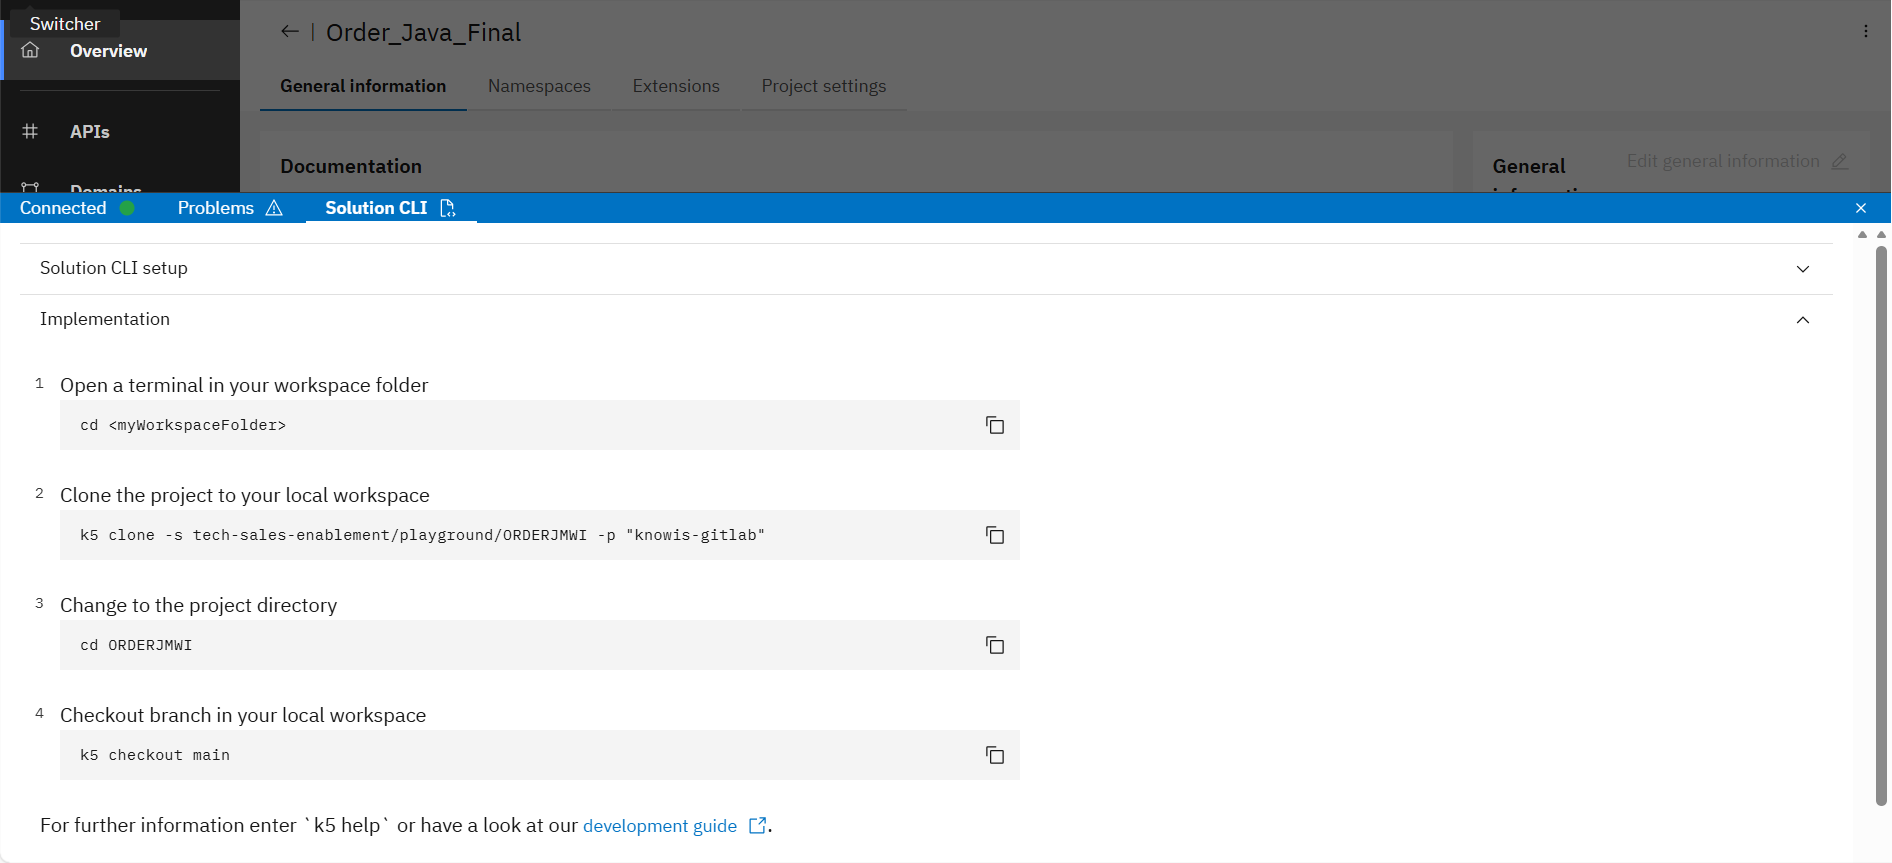
Now follow the instructions in section "Implementation" to clone and build the project locally.
Before proceeding, it is necessary that the build of the project can be created successfully. So if the project cloning ends with errors or there are compilation errors, mitigate all errors to enable a successful build of the project.
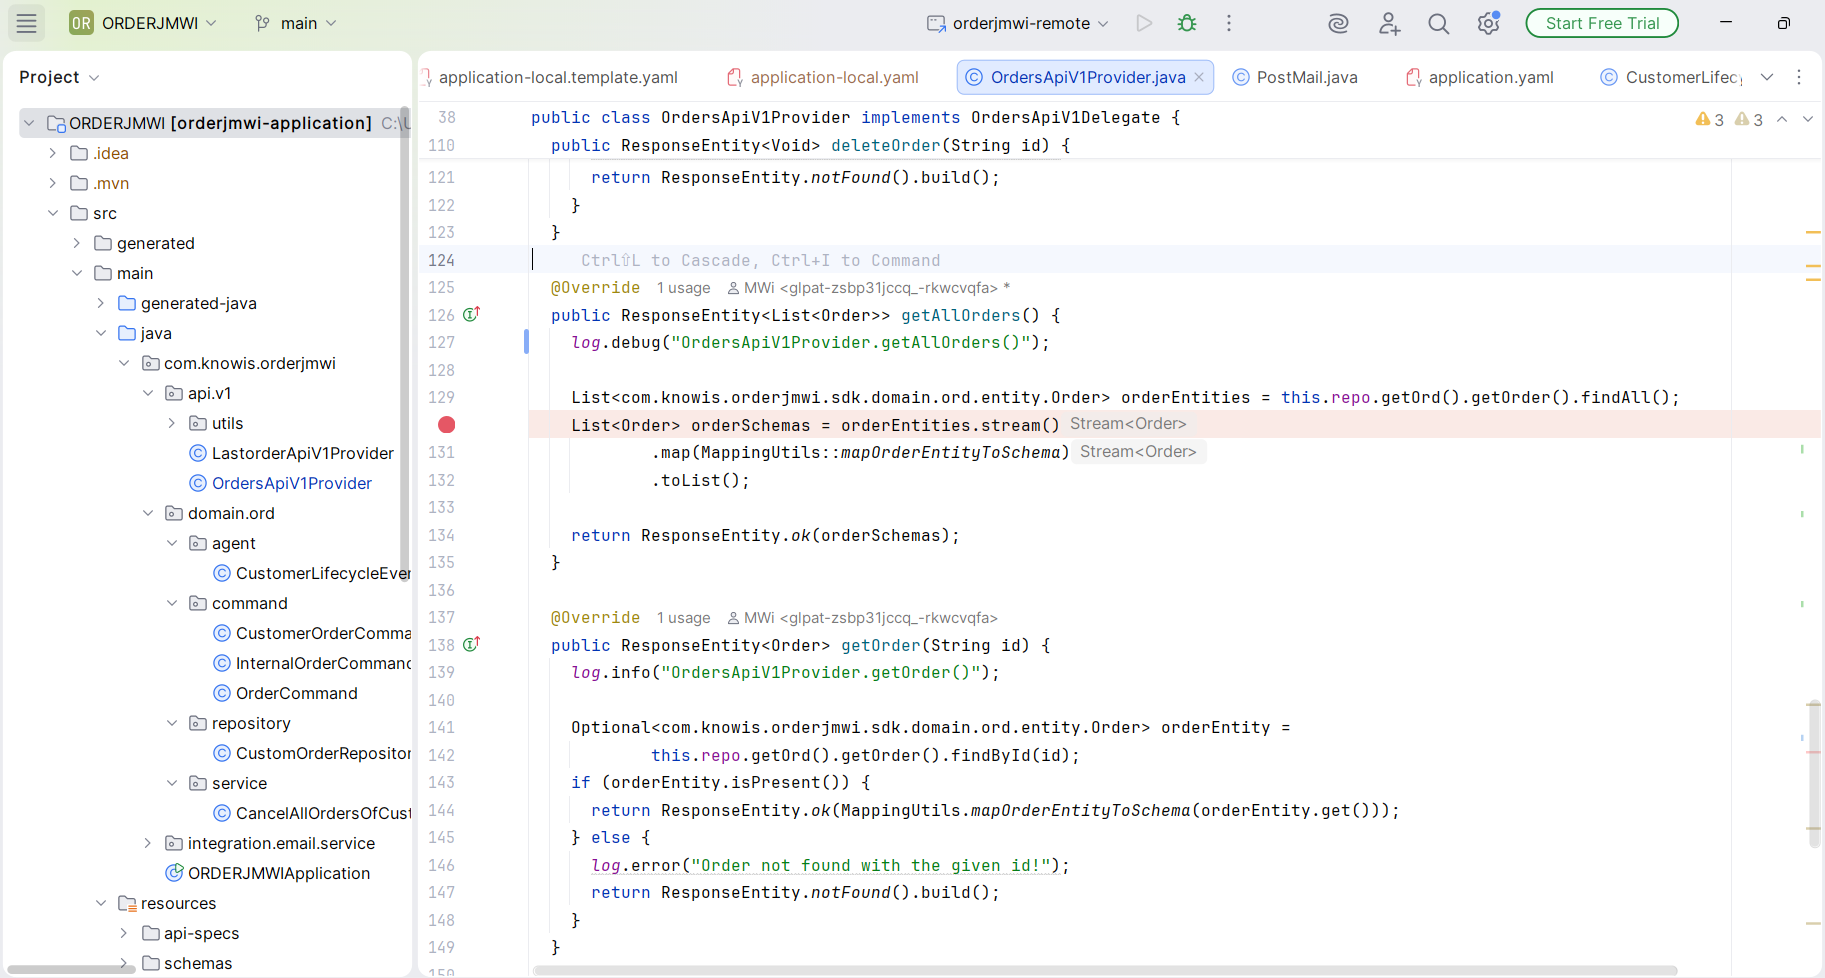
3. Setup your IDE for remote debugging
Open your Java project in your IDE and create a new remote debug configuration and add the following settings:
- Host: localhost
- Port: 5005
- Command line arguments:
-agentlib:jdwp=transport=dt_socket,server=y,suspend=n,address=*:5005
In IntelliJ, an example remote debug configuration looks like this:
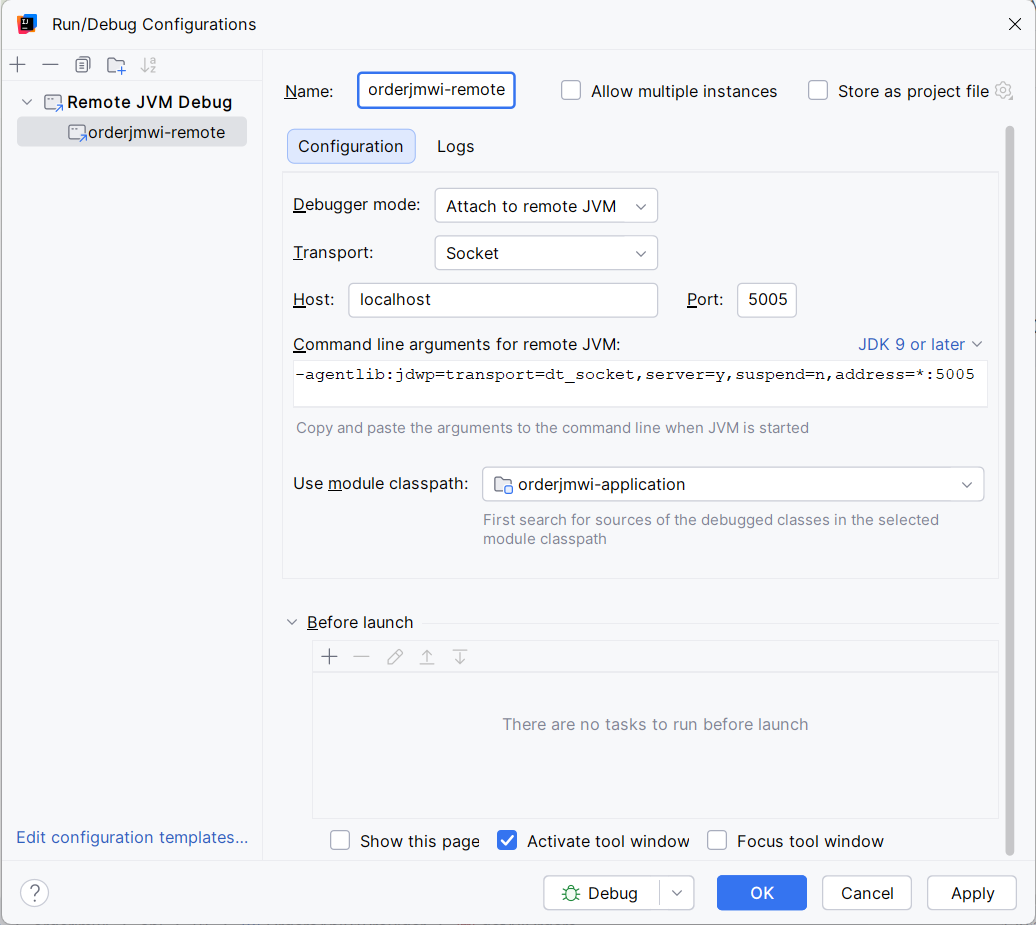
Now your IDE is able to connect to the remote application's JVM running on the pod.
4. Port-Forwarding
-
Open an CLI and login to your cluster.
-
Then execute the port-forwarding command:
kubectl port-forward <podname> 5005:5005 -n <namespace>Parameters:
<podname>: The name of the pod running on a Kubernetes cluster<namespace>: The Kubernetes namespace (same as theruntimeNamein step 3)
💡Search for the podnameIf you don't know the podname, you can search it with your solution acronym (in lowercase, e.g.
orders). In general, the podname has the following pattern:k5-<solutionAcronym>-...The following command provides you all pods that contain your solution acronym in their podname:
kubectl get pods -n <namespace> | grep <solutionAcronym>Then use the found podname for the port-forwarding command.
Now the traffic on port 5005 (used by the debugger) is forwarded from the pod to your local machine.
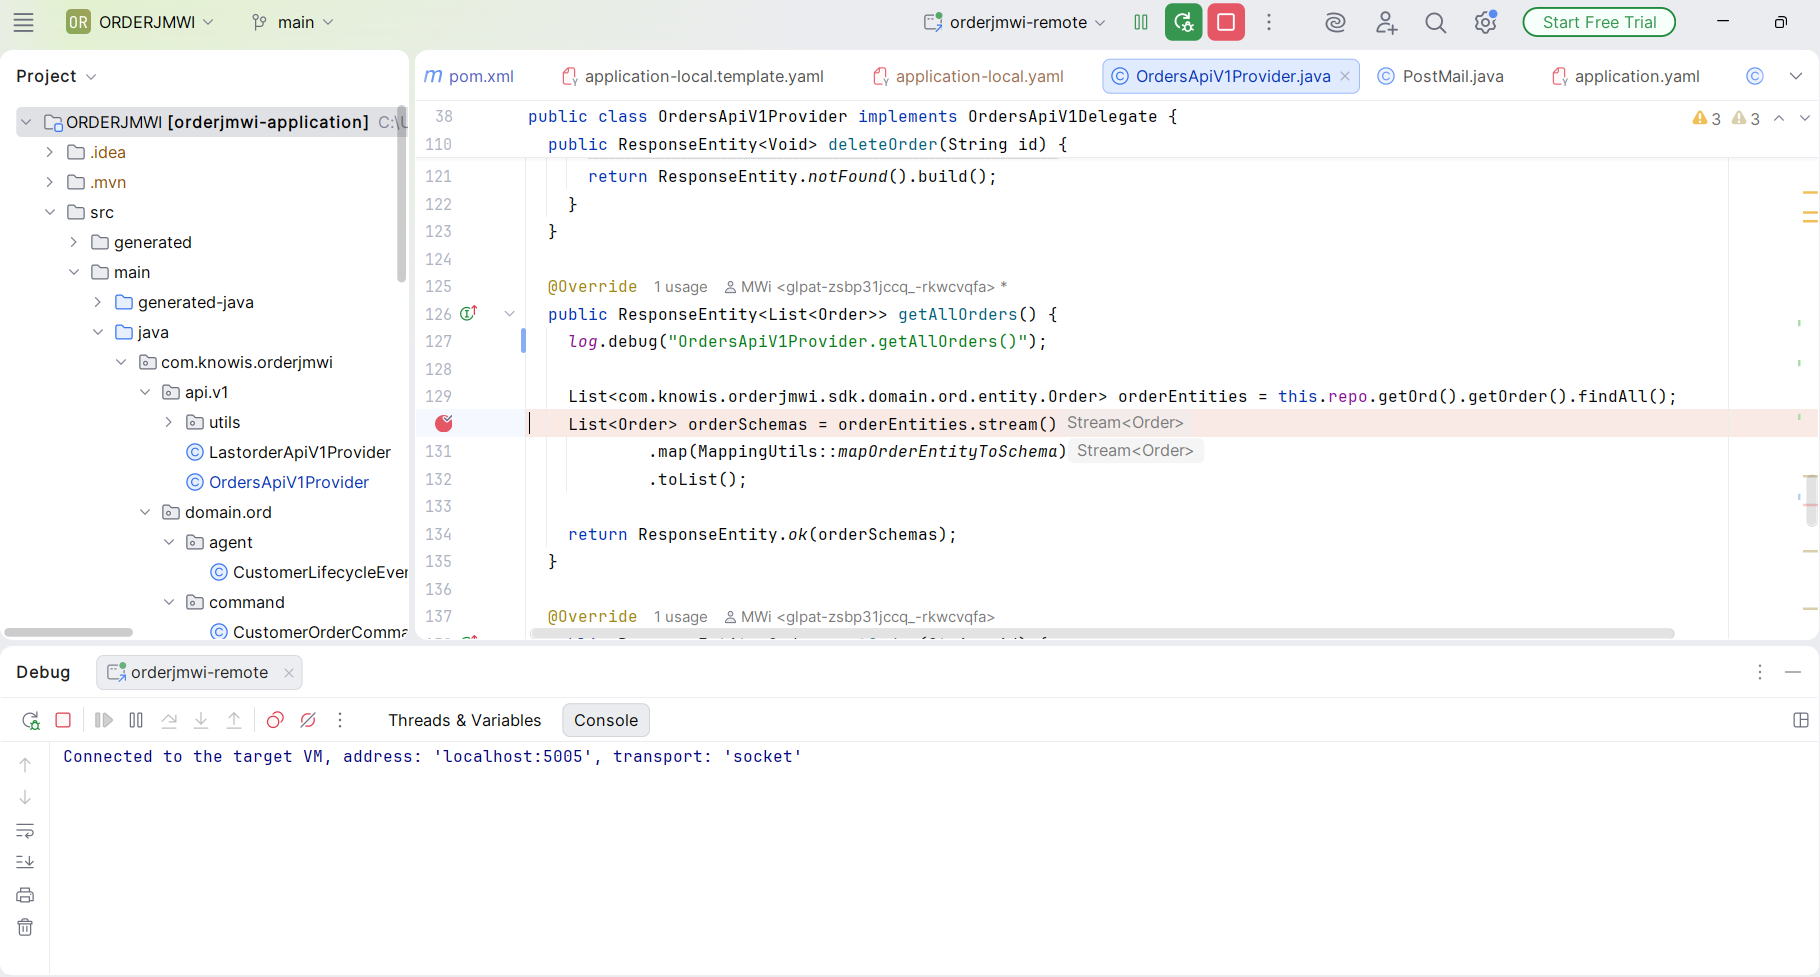
5. Start debugging
-
Start the debugger in your IDE.
-
Trigger requests of your deployed solution.
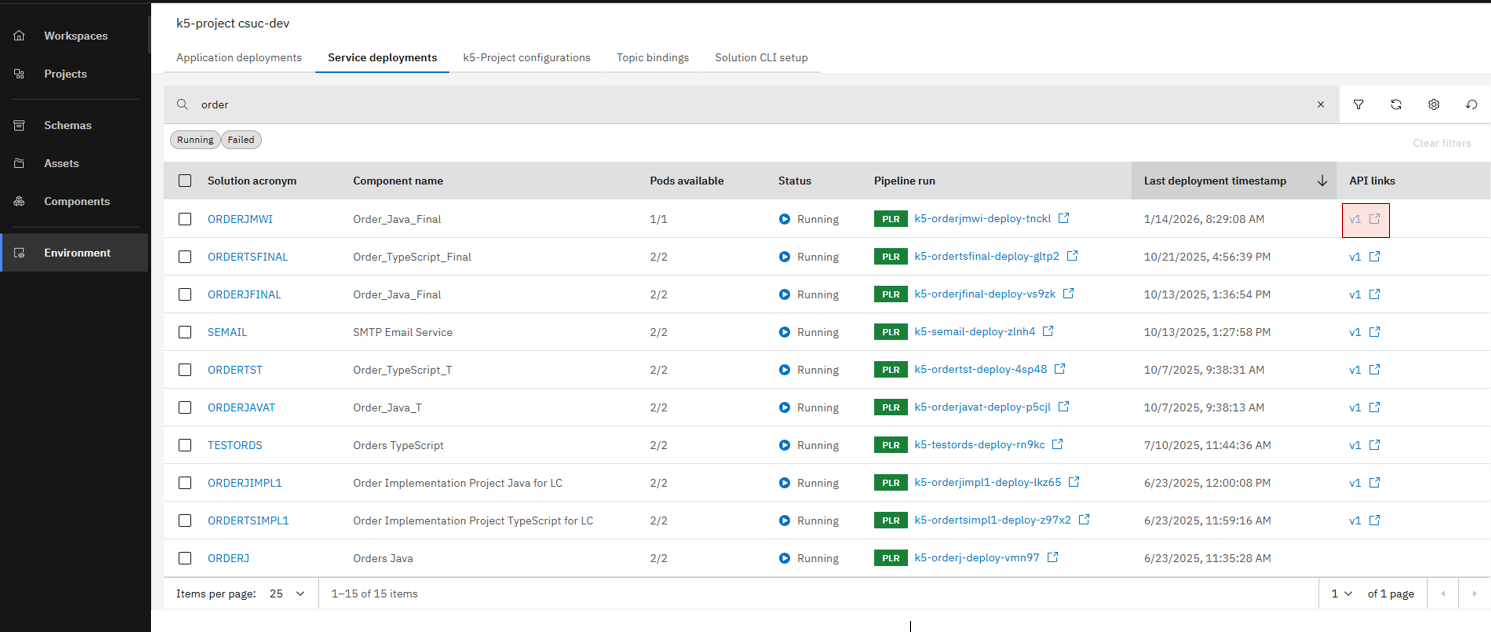
Open the Environment page, then click the link to the Swagger UI of your deployed solution (either in tab "Application deployments" or "Service deployments").
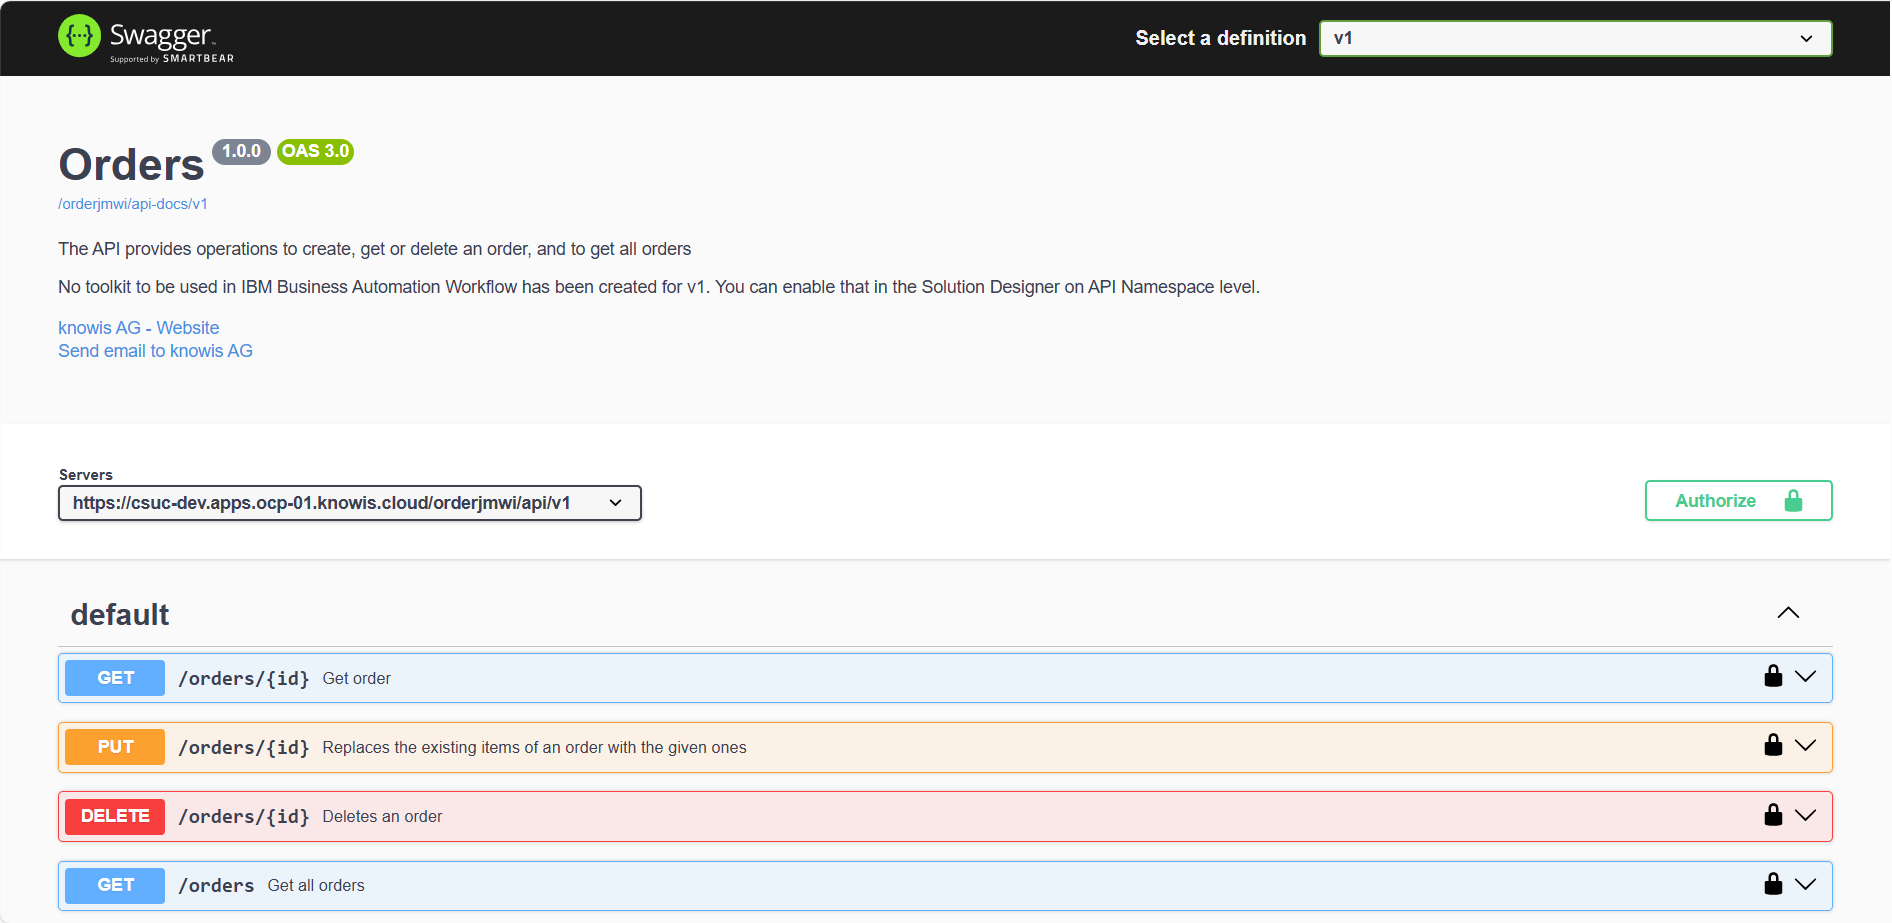
Authorize against the Swagger UI.
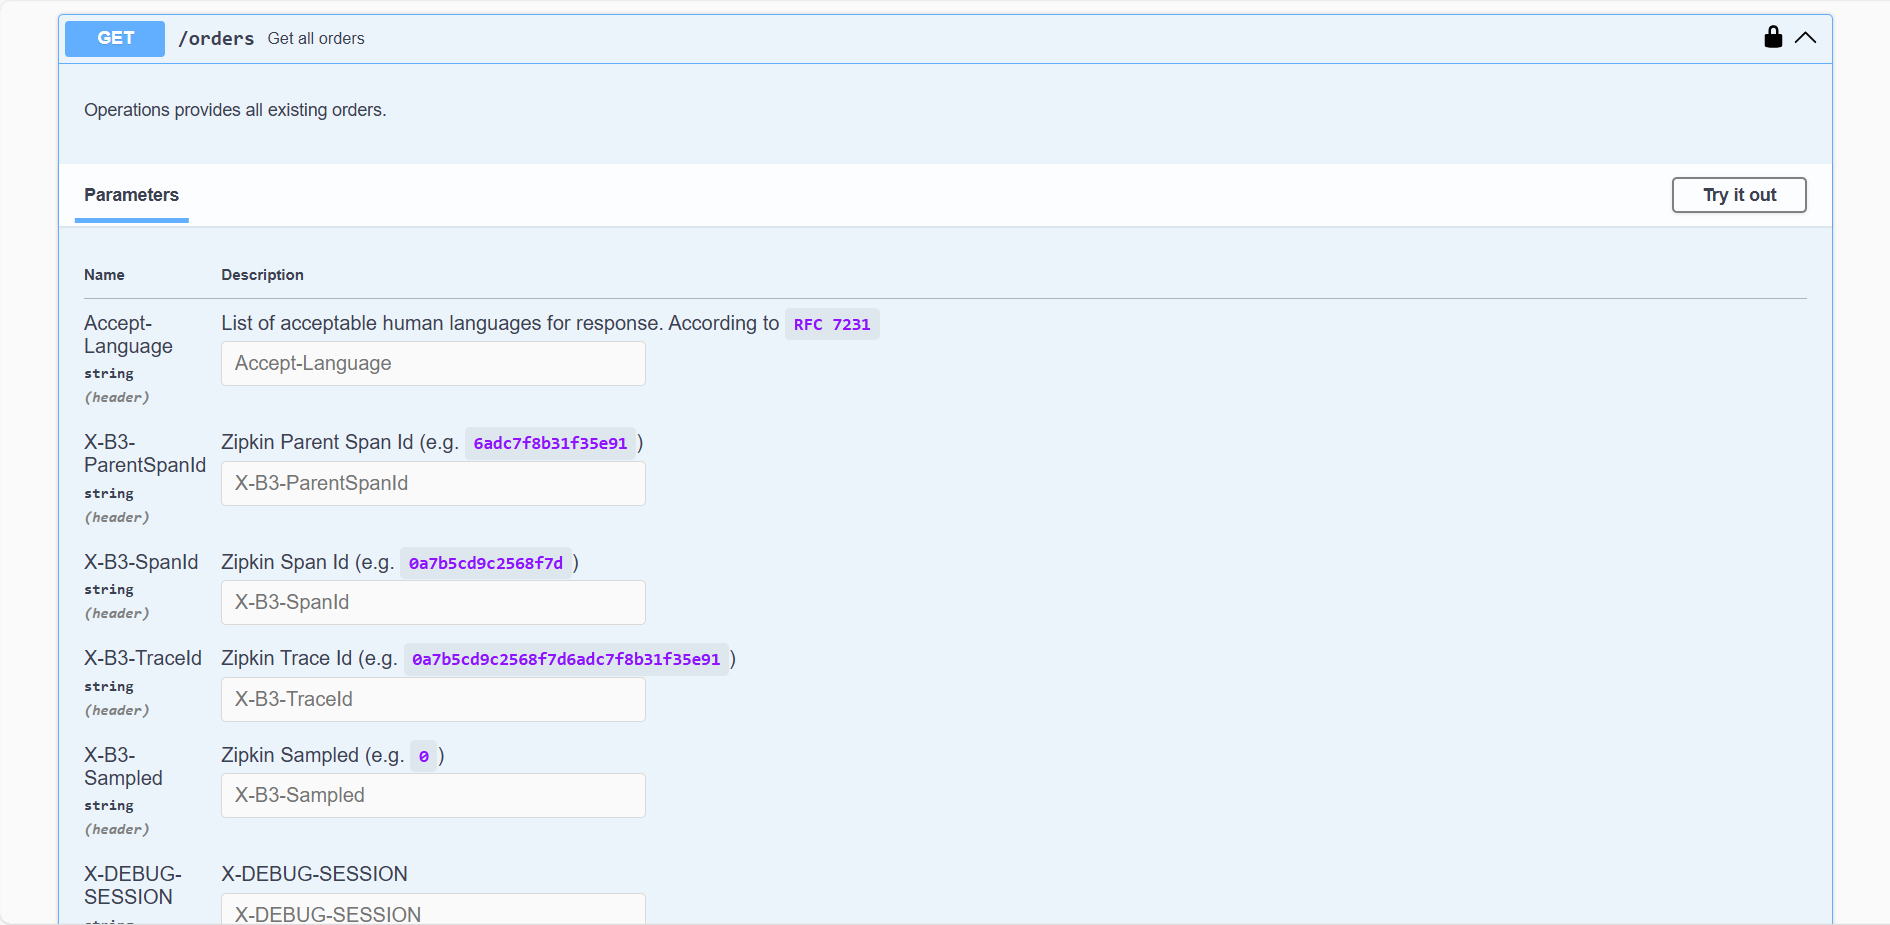
Select your desired API operation and click on "Try out".
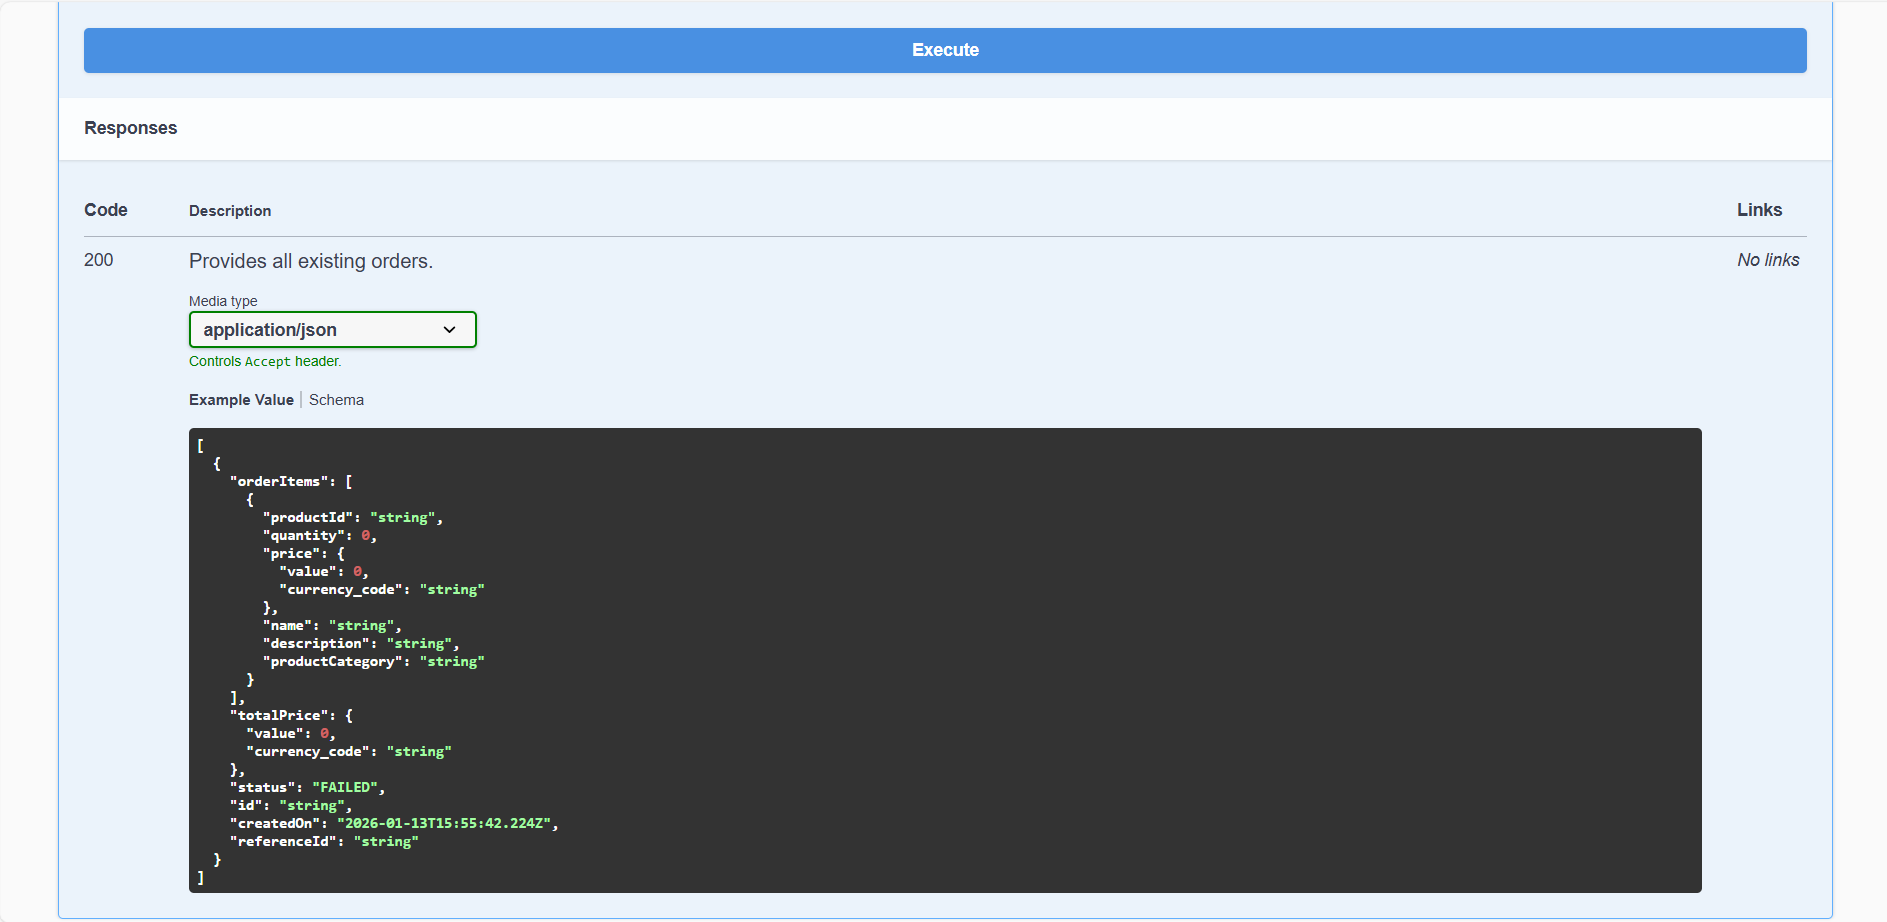
Then click on "Execute".
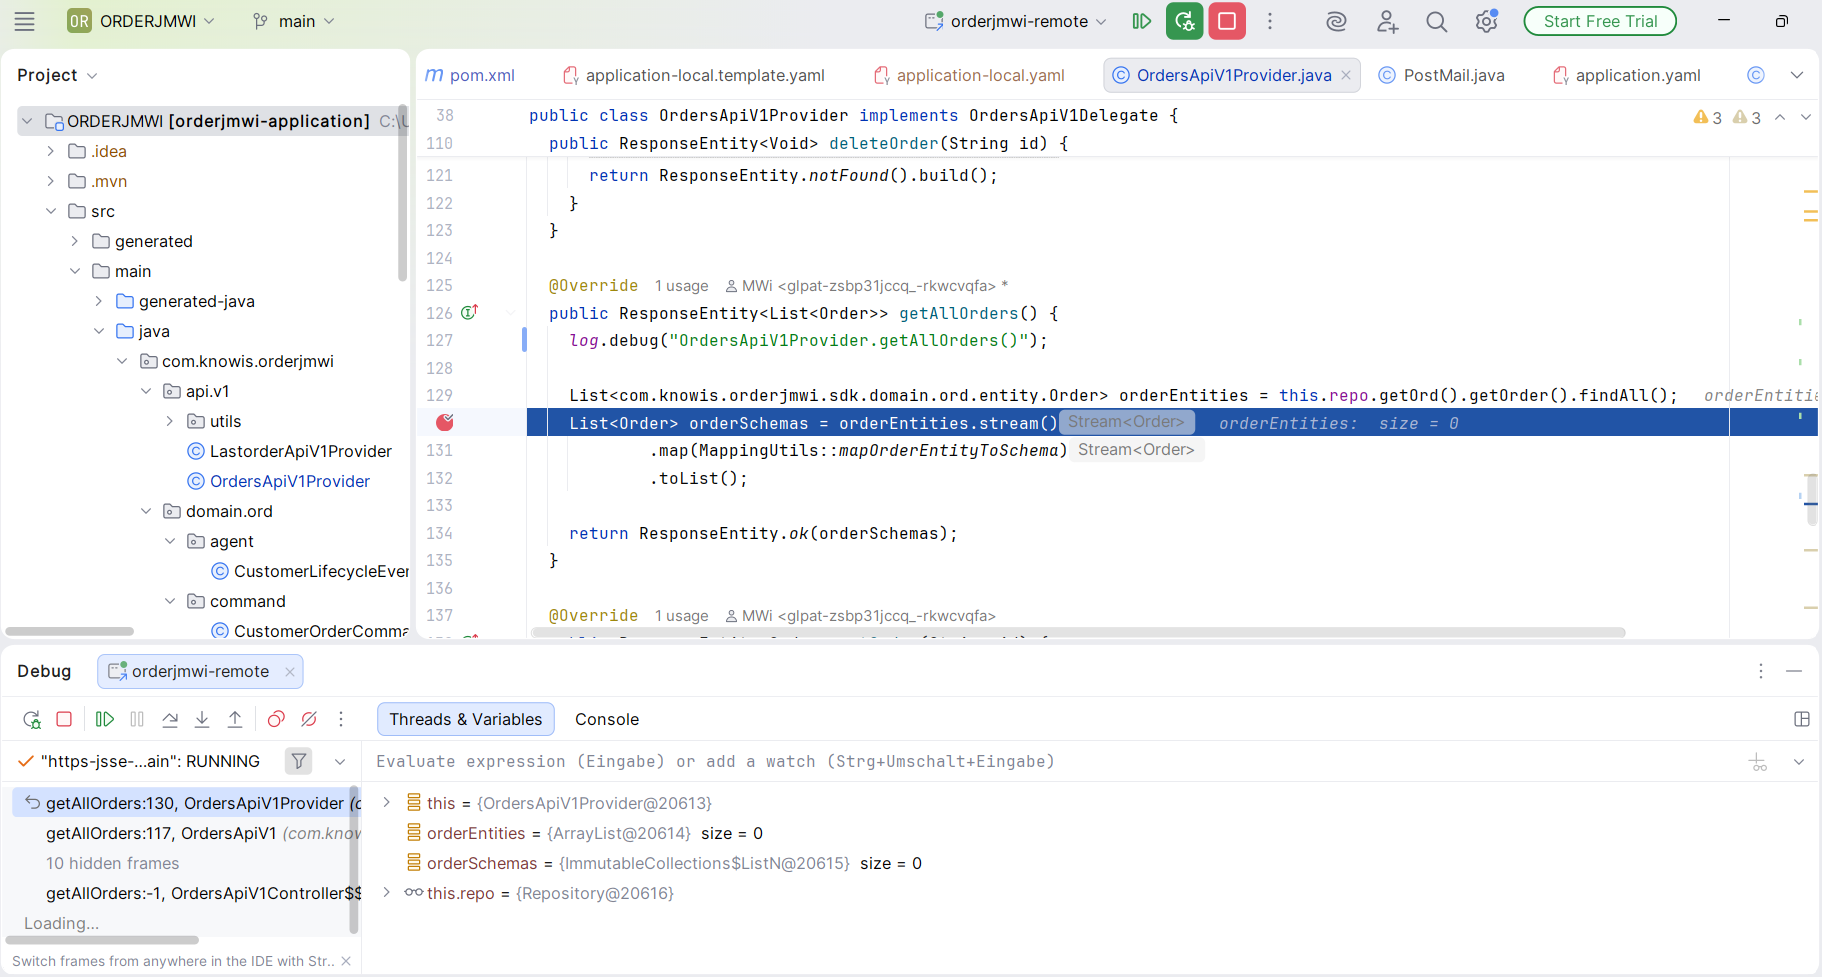
The IDE opens and stops at the breakpoints you set. You are able to continue inspecting your code from there.
Please note that this works for the other IDEs as well. For more info please see here.
Related Links
You have successfully learned how to use JVM's remote debugging capabilities to inspect the behaviour of your Java service.