View Distributed Tracing
Goal: Enable and configure distributed tracing for REST calls, MongoDB operations, and Kafka events in Java stack 2.0 applications using OpenTelemetry with Jaeger.
Description
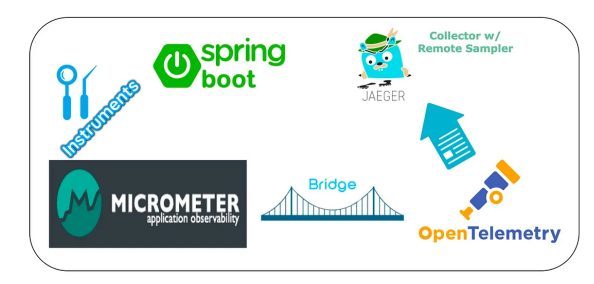
This How-To guides you through configuring distributed tracing in Java Spring Boot 3 applications (Java Stack 2.0). With Spring Boot 3, the previous Sleuth library is no longer supported, and applications now use Micrometer with OpenTelemetry for tracing.
Distributed tracing helps you monitor and troubleshoot complex distributed systems by tracking request flows across service boundaries. This guide focuses on integrating with Jaeger as a trace collector, but the configuration should theoretically work with other collectors as well.
The solution described in this guide has been tested only with Jaeger. While it should work with other collectors like Zipkin, be aware that the configuration might need adjustments for those environments.
Preconditions
- Java Spring Boot 3 Application: Your application uses Java Stack 2.0 with Spring Boot 3
- Maven/Gradle: You use Maven or Gradle for dependency management
- Jaeger Instance: You have access to a Jaeger instance for collecting and visualizing traces
- Base Knowledge: Basic understanding of distributed tracing concepts
Step-by-Step Guide
1. Add Required Dependencies
1.1. Add Core Tracing Dependencies:
-
Update your
pom.xmlwith the following dependencies:<!-- Tracing -->
<dependency>
<groupId>io.micrometer</groupId>
<artifactId>micrometer-tracing-bridge-otel</artifactId>
</dependency>
<dependency>
<groupId>io.opentelemetry.instrumentation</groupId>
<artifactId>opentelemetry-instrumentation-api</artifactId>
<version>1.32.0</version>
</dependency>
<dependency>
<groupId>io.opentelemetry.instrumentation</groupId>
<artifactId>opentelemetry-spring-boot-starter</artifactId>
<version>1.32.0-alpha</version>
</dependency>
<dependency>
<groupId>io.opentelemetry.instrumentation</groupId>
<artifactId>opentelemetry-instrumentation-api-semconv</artifactId>
<version>1.32.0-alpha</version>
</dependency>
1.2. Add Kafka Tracing Dependencies:
-
For Kafka integration, add:
<!-- Kafka tracing -->
<dependency>
  <groupId>io.opentelemetry</groupId>
  <artifactId>opentelemetry-sdk-extension-autoconfigure</artifactId>
</dependency>

<dependency>
  <groupId>io.opentelemetry.instrumentation</groupId>
  <artifactId>opentelemetry-kafka-clients-2.6</artifactId>
  <version>1.32.0-alpha</version>
</dependency>
1.3. Add MongoDB Tracing Dependencies:
-
For MongoDB integration, add:
<!-- MongoDB tracing-->
<dependency>
  <groupId>io.opentelemetry.instrumentation</groupId>
  <artifactId>opentelemetry-mongo-3.1</artifactId>
  <version>1.32.0-alpha</version>
</dependency>
1.4. Configure Dependency Management:
-
Add OpenTelemetry BOM to your dependency management section:
<dependencyManagement>
  <dependencies>
    <dependency>
      <groupId>io.opentelemetry</groupId>
      <artifactId>opentelemetry-bom</artifactId>
      <version>1.32.0</version>
      <type>pom</type>
      <scope>import</scope>
    </dependency>
  </dependencies>
</dependencyManagement>
2. Configure Application Properties
2.1. Add OpenTelemetry Properties:
-
Add the following to your
application.yaml:otel.exporter.otlp.traces.endpoint: YOUR-JAEGER-SERVICE-URL:4317
otel.exporter.otlp.metrics.enabled: false
management.tracing.propagation.produce: W3C, B3_MULTI
- Jaeger's gRPC port 4317 must be exposed for trace collection
- The
propagation.produceproperty provides compatibility with both Java Stack 2.0 (W3C headers) and Java Stack 1.0 (B3 headers)
2.2. Configure Service Environment Variables:
-
Add these environment variables to your service's solution configuration:
-
For application deployments, add them to the service's custom configuration under "additionalJavaOptions":
otel.java.global-autoconfigure.enabled=true
otel.metrics.exporter=none
2.3. Configure Logging:
-
Update your
logback-spring.xmlto include trace and span IDs in log output:<property
name="CONSOLE_LOG_PATTERN"
value="${CONSOLE_LOG_PATTERN:-%clr(%d{yyyy-MM-dd HH:mm:ss.SSSZ}){faint} %clr(${LOG_LEVEL_PATTERN:-%5p}) %clr(${PID:- }){magenta} %clr(---){faint} %clr([%15.15t]){faint} %clr([USER:%X{X-USER},%X{traceId:-},%X{spanId:-}]) %clr(%-40.40logger{39}){cyan} %clr(:){faint} %m%n${LOG_EXCEPTION_CONVERSION_WORD:-%wEx}}"
/>
3. Configure Kafka Tracing
3.1. Create a Kafka Producer Customizer:
-
Create a class to add tracing interceptors to Kafka producers:
@Qualifier("kafkaProducerCustomizer")
public class KafkaProducerCustomizer implements KafkaCustomizer {
  // ... existing code ...

  @Override
  public Map<String, Object> getConfig(String topicAlias, KafkaBinding kafkaBrokerConfig) {
    Map<String, Object> props = new HashMap<>();

    // ... existing configuration code ...

    // Add tracing interceptor
    props.put(ProducerConfig.INTERCEPTOR_CLASSES_CONFIG, TracingProducerInterceptor.class.getName());

    return props;
  }
}
4. Configure Tracing Infrastructure
4.1. Create TracingConfiguration Class:
-
Create a configuration class for all tracing components:
@Configuration
public class TracingConfiguration {

  /* Create custom producer configurations for Kafka events */
  @Bean
  KafkaProducerCustomizer kafkaProducerCustomizer() {
    return new KafkaProducerCustomizer();
  }

  /* Configuration to generate custom span IDs */
  @Bean
  SpanAspect spanAspect(MethodInvocationProcessor methodInvocationProcessor) {
    return new SpanAspect(methodInvocationProcessor);
  }

  @Bean
  NewSpanParser newSpanParser() {
    return new DefaultNewSpanParser();
  }

  @Bean
  MethodInvocationProcessor methodInvocationProcessor(NewSpanParser newSpanParser, Tracer tracer, BeanFactory beanFactory) {
    return new ImperativeMethodInvocationProcessor(newSpanParser, tracer, beanFactory::getBean,
            beanFactory::getBean);
  }

  /* Configuration to trace calls to the MongoDB */
  @Bean
  public MongoTelemetry mongoTelemetry(OpenTelemetry openTelemetry) {
    return MongoTelemetry.builder(openTelemetry).build();
  }

  @Bean
  @ConditionalOnMissingBean
  public MongoDbConfiguration mongoDbConfiguration() {
    return new MongoDbConfiguration();
  }

  @Bean
  @ConditionalOnBean(MongoDbConfiguration.class)
  public MongoClientSettings mongoClientSettings(MongoDbConfiguration mongoDbConfiguration,
                                               MongoTelemetry mongoTelemetry,
                                               KubernetesServiceBindingService kubernetesServiceBindingService) {
    // ... existing configuration code ...

    return MongoClientSettings.builder()
            .applyConnectionString(new ConnectionString(effectiveUri))
            .addCommandListener(mongoTelemetry.newCommandListener())
            .build();
  }

  @Bean
  @Primary
  @ConditionalOnBean(MongoClientSettings.class)
  public MongoClient mongoClient(MongoClientSettings mongoClientSettings) {
    return com.mongodb.client.MongoClients.create(mongoClientSettings);
  }
}
5. Add Custom Span Creation (Optional)
5.1. Annotate Methods for Custom Spans:
-
Add the
@NewSpanannotation to methods you want to trace:import io.micrometer.tracing.annotation.NewSpan;
@NewSpan("My method")
public void methodToTrace() {
// Method implementation
}
6. Filter Unwanted Traces (Optional)
6.1. Add Observation Registry Customizer:
-
To exclude traces from specific libraries, add to
TracingConfiguration:@Bean
ObservationRegistryCustomizer<ObservationRegistry> observationRegistryCustomizer() {
return (registry) -> registry.observationConfig()
.observationPredicate(ObservationPredicates.noSpringSecurity())
.observationPredicate(ObservationPredicates.noHttpRequests())
.observationPredicate(ObservationPredicates.noActuator());
}
6.2. Create ObservationPredicates Class:
-
Create a utility class for filtering trace categories:
import org.springframework.http.server.observation.ServerRequestObservationContext;
import io.micrometer.observation.ObservationPredicate;

public final class ObservationPredicates {

  private ObservationPredicates() {
  }

  public static ObservationPredicate noSpringSecurity() {
    return (name, context) -> !name.startsWith("spring.security.");
  }

  public static ObservationPredicate noHttpRequests() {
    return (name, context) -> !name.startsWith("http.server.requests");
  }

  public static ObservationPredicate noActuator() {
    return (name, context) -> {
      if (context instanceof ServerRequestObservationContext srCtx) {
        return !srCtx.getCarrier().getRequestURI().startsWith("/actuator");
      }
      return true;
    };
  }
}
6.3. Filter Specific HTTP Endpoints (Optional):
- For finer control over which HTTP endpoints generate traces, follow these steps:
- Add the
opentelemetry-spring-webmvc-6.0dependency - Disable automatic instrumentation in
application.yaml - Create a custom filter wrapper
- Register the filter as a Bean in
TracingConfiguration
6.4. Filter Outgoing REST Calls (Optional):
- For filtering outgoing REST calls, add custom request interceptors
- See the detailed implementation in the original document
Conclusion
Congratulations! You have successfully integrated distributed tracing into your Java Stack 2.0 application using Micrometer, OpenTelemetry, and Jaeger. You can now visualize request flows across your services, track performance, and troubleshoot issues more effectively.