Debug Events locally
I have a Domain Service project with Event publishing inside and I want to debug e.g. the event-publishing Command. How can I debug my Command and see whether my Event was published correctly?
Description
This How-To will guide you through the process of setting up Kafka on your local machine, using Docker. Also it explains how you can discover the published events on your local machine.
Please note that the links to the workbench tools in this tutorial only apply to the IBM Education Environment we provide. If you are using a different environment, e.g. your own installation, you will need to navigate directly to the required tools.
This document describes the necessary steps using Microsoft Windows. If you are using an other operating system, you may have to adopt some steps.
Preconditions
- You have a Domain Service project in which an event shall be sent, e.g. within a Command or a Service.
- You modeled it in the Solution Designer, implemented it and pushed it successfully.
- Your event uses a Topic Binding, which is configured in the Environment page (see example in next chapter).
- The deploy pipeline for this Project was completed successfully.
- Local debugging for this Project was set-up. See documentation.
Sample Project 'TRAINER'
To reproduce the necessary steps, we created a simple Project 'TRAINERS' which implements a Factory Command to onboard a new trainer and to publish an event 'NewTainerOnboarded'.
In the following it is shown how the Command and the Event were modeled in the Solution Designer and how it is implemented.
-
Created a Factory Command which has an Event associated:
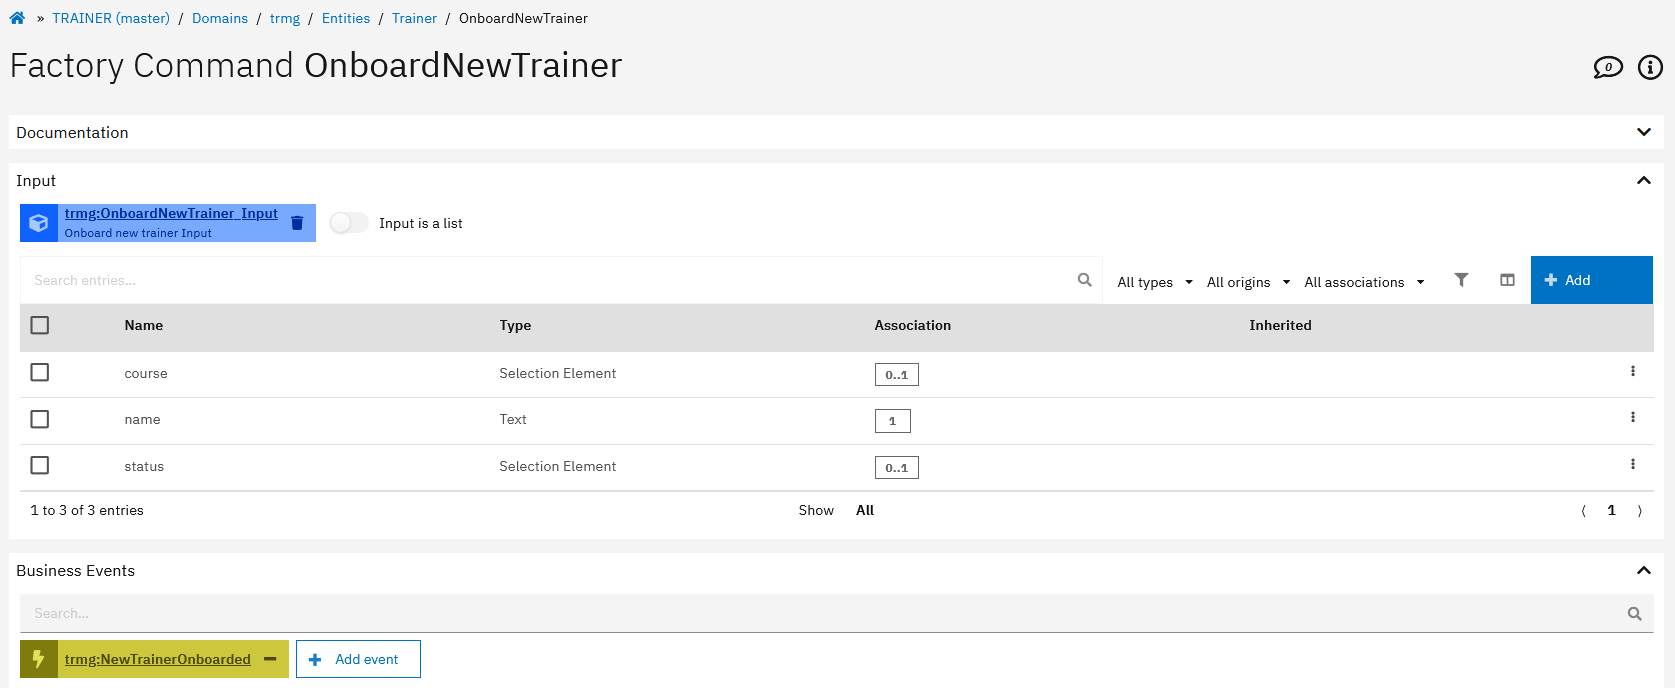
-
The Event has a payload modeled which holds additional information of what has happened:
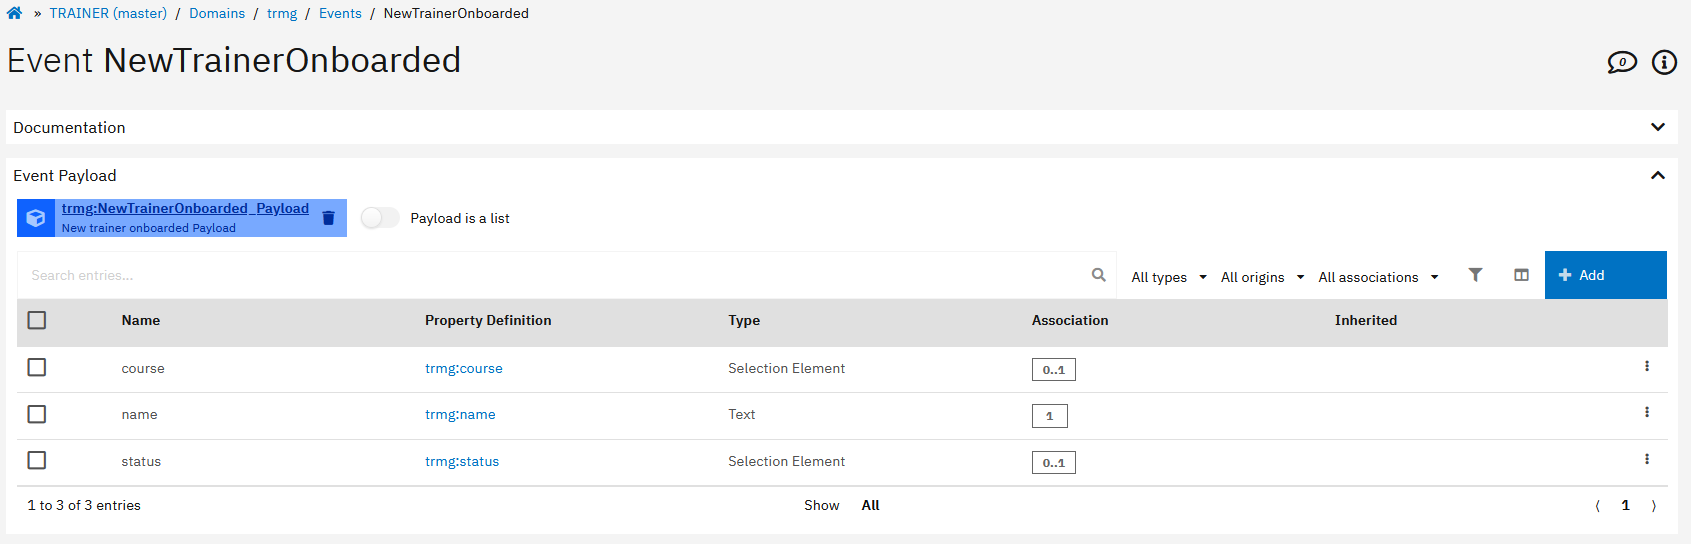
-
In the implementation of the Command the event will be published:
import { commands } from 'solution-framework';
export default class extends commands.trmg_OnboardNewTrainer {
  public async execute(): Promise<void> {
    const log = this.util.log;
    log.debug('trmg_OnboardNewTrainer.execute()');

    const {name, status, course} = this.input;
    // Create new instance of Trainer
    this.instance = this.factory.entity.trmg.Trainer();
    // Map input values to entity
    this.instance.name = name;
    this.instance.status = status;
    this.instance.course = course;
    // Persist instance
    await this.instance.persist();

    // Create new Event NewTrainerOnboarded
    const newTrainerOnboardedEvent = this.factory.event.trmg.NewTrainerOnboarded();
    newTrainerOnboardedEvent.payload = this.factory.entity.trmg.NewTrainerOnboarded_Payload();
    newTrainerOnboardedEvent.payload.name = name;
    newTrainerOnboardedEvent.payload.course = course;
    newTrainerOnboardedEvent.payload.status = status;
    // Publish Event
    await newTrainerOnboardedEvent.publish();
  }
  public async available(): Promise<boolean> {
    return true;
  }
}
-
The Event uses a Topic Binding, whose details can be found in the Environment page:
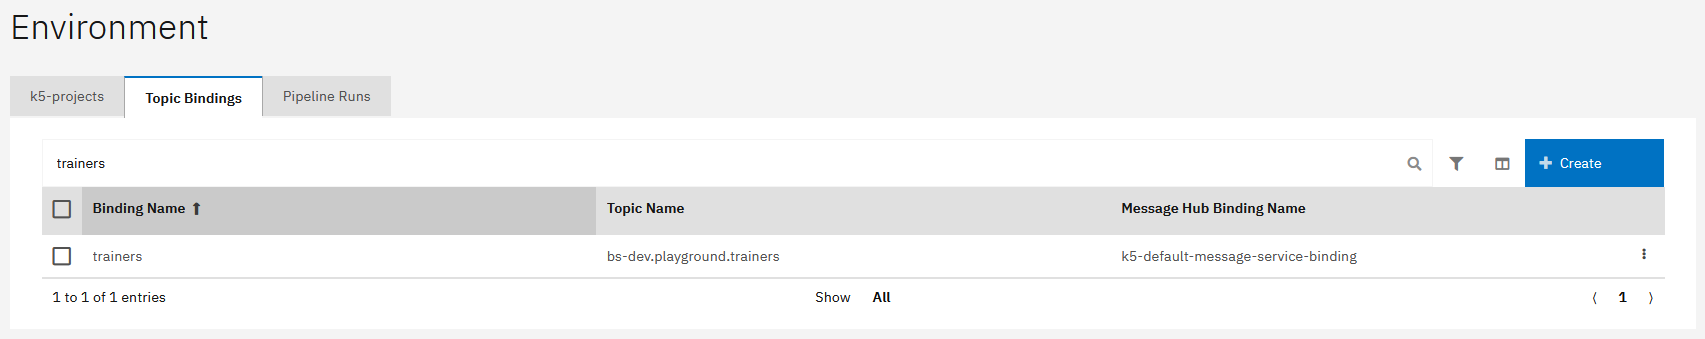
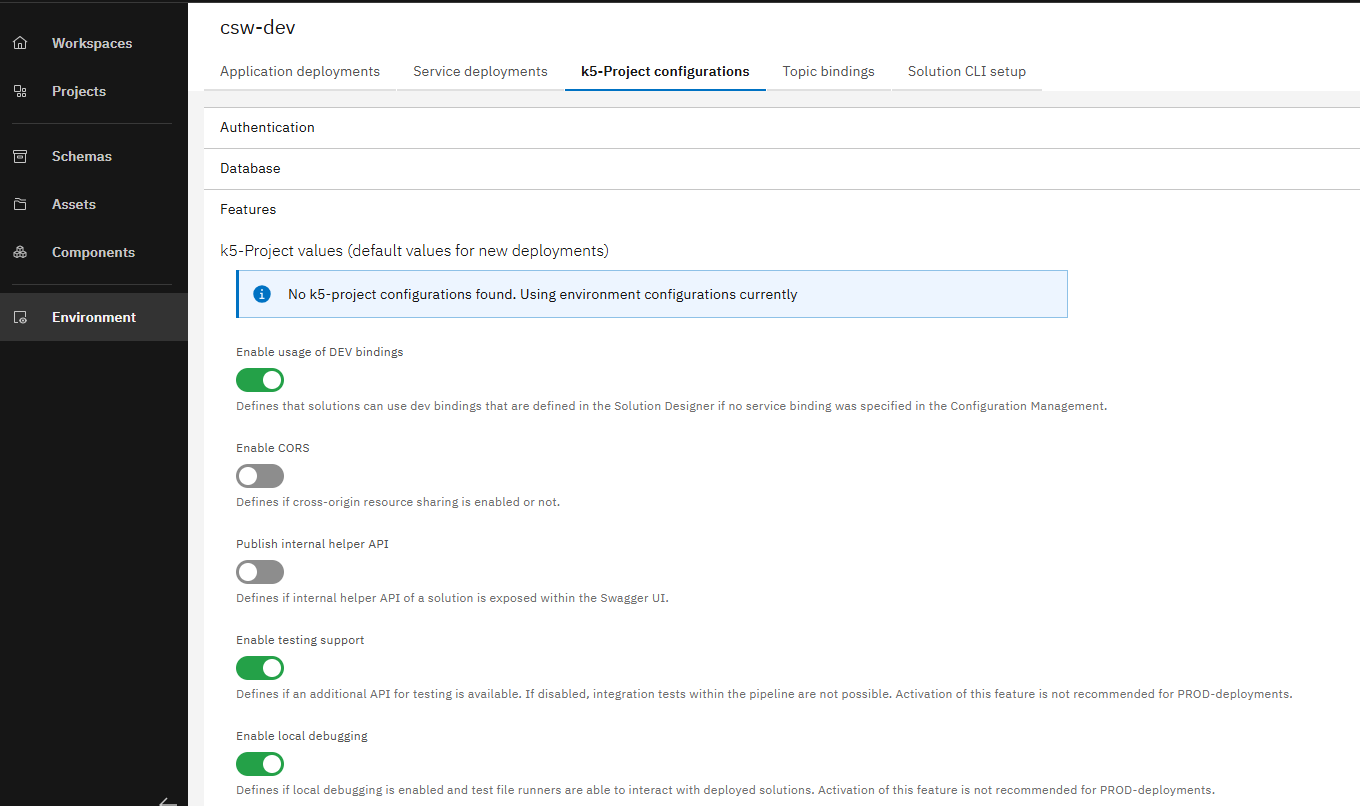
-
The Features "Enable testing support" and "Enable local debugging" are selected in the Deployment Configuration of your project in the Environment page.
Steps to set-up local debugging for events
Download necessary tools
To set up Apache Kafka as a Docker image to see the published events, you need the following tools:
Please note that the software to be downloaded is provided by third parties and we do not take any warranty for that. Please check also the licence agreements for these software products.
We have used the above tools for this how-to because they provide an easy way to access and visualize events on your local computer. However, there may be other options that are also suitable for this use case.
Install and set up Docker in your project to start Kafka
- Install the downloaded Docker Desktop installation file by executing it and follow the proposed steps.
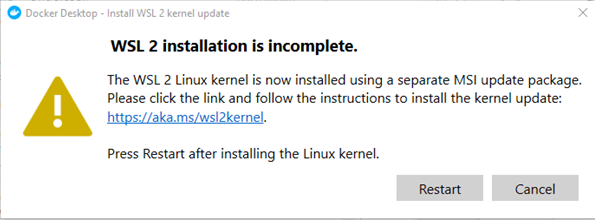
During the installation you may be asked to install a WSL2 (Windows-Subsystem for Linux) kernel to complete installation. If so, please follow the link to download and install the kernel. You do not need to install a Linux distribution.
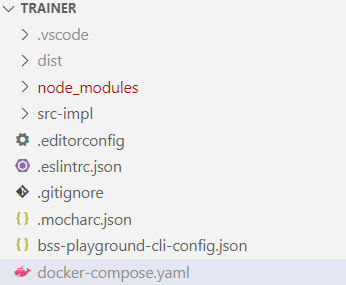
- Open your project in Visual Studio Code, create a
docker-compose.yamlin the projects directory and copy the content (as shown below) into it.
version: '2'
services:
  zookeeper:
    image: confluentinc/cp-zookeeper:latest
    environment:
      ZOOKEEPER_CLIENT_PORT: 2181
      ZOOKEEPER_TICK_TIME: 2000
    ports:
      - 22181:2181

  kafka:
    image: confluentinc/cp-kafka:latest
    depends_on:
      - zookeeper
    ports:
      - 29092:29092
    environment:
      KAFKA_BROKER_ID: 1
      KAFKA_ZOOKEEPER_CONNECT: zookeeper:2181
      KAFKA_ADVERTISED_LISTENERS: PLAINTEXT://kafka:9092,PLAINTEXT_HOST://localhost:29092
      KAFKA_LISTENER_SECURITY_PROTOCOL_MAP: PLAINTEXT:PLAINTEXT,PLAINTEXT_HOST:PLAINTEXT
      KAFKA_INTER_BROKER_LISTENER_NAME: PLAINTEXT
      KAFKA_OFFSETS_TOPIC_REPLICATION_FACTOR: 1
The docker-compose.yaml defines the services that shall be run on Docker, in our case Kafka (besides additional configuration). If will be used when executing docker-compose up.
- To avoid uploading the
docker-compose.yamlto git, add it to the.gitignorefile as shown below.
#docker-compose
docker-compose.yaml
- Open the bash in Visual Studio Code and enter
docker-compose up, which will download the container image (for the first time) and run it as Docker container (which may take a while - especially for the first start).
After restarting your machine, you need to run docker-compose up again!
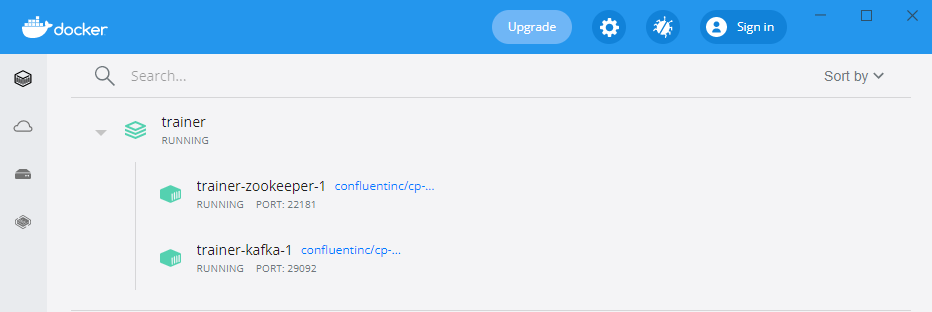
- When the container has been started, you will see this not only in the terminal but also in the UI of Docker Desktop.
Connect to the Schema Registry
- Create a new file ".env" in the root directory of your project folder
- Add the schema registry configuration properties to it.
Please choose the right values, depending on your installation. You can get the relevant information either from your administrator or by checking the environment variables of your deployed service using the OpenShift console.
SCHEMA_REGISTRY_SECURITY_ENABLED = true
SCHEMA_REGISTRY_URL = <schema-registry-url>
SCHEMA_REGISTRY_AUTH_SERVER_URL = <schema-registry-authentication-server-url>
SCHEMA_REGISTRY_AUTH_REALM = <schema-registry-authentication-server-url>
SCHEMA_REGISTRY_CLIENT_ID = <schema-registry-client-id>
SCHEMA_REGISTRY_CLIENT_SECRET = <schema-registry-client-secret>
SCHEMA_REGISTRY_AUTH_SERVER_URL, SCHEMA_REGISTRY_AUTH_REALM, SCHEMA_REGISTRY_CLIENT_ID, SCHEMA_REGISTRY_CLIENT_SECRET are only needed if the schema registry has security enabled
- Open the file
/.vscode/launch.json - Add the property "envFile" to the configurations so that it looks the following:
 {
    "version": "0.2.0",
    "configurations": [
        {
            "type": "node",
            "request": "launch",
            "name": "Current Test",
            "protocol": "inspector",
            "showAsyncStacks": true,
            "console": "internalConsole",
            "internalConsoleOptions": "openOnSessionStart",
            "preLaunchTask": "Update Debug Credentials",
            "program": "${workspaceFolder}/node_modules/mocha/bin/_mocha",
            "cwd": "${workspaceFolder}/",
            "args": [
                "--require",
                "ts-node/register/transpile-only",
                "--colors",
                "${file}"
            ],
            "outputCapture": "std",
            "envFile": "${workspaceFolder}/.env"
        }
    ]
}
- Run your test-execution
Install and configure Offset Explorer
- Install the Offset Explorer by executing the installation file, start it and create first a new Cluster.
You will need to have a commercial license for the Offset Explorer. You can also use https://akhq.io/ as an alternative.
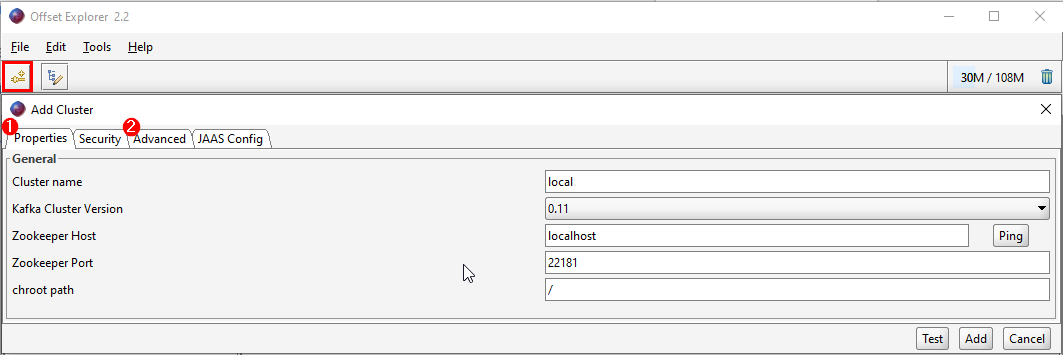
To do this, enter the following in the "Properties"-tab (1).
Cluster name:           local
Kafka Cluster Version:  0.11
Zokeeper Host:          localhost
Zookepper Port:         22181
chroot path:            /
- Then please switch to the "Advanced"-tab (2) and paste the following in the "Bootstrap servers" field:
PLAINTEXT://kafka:9092,PLAINTEXT_HOST://localhost:29092
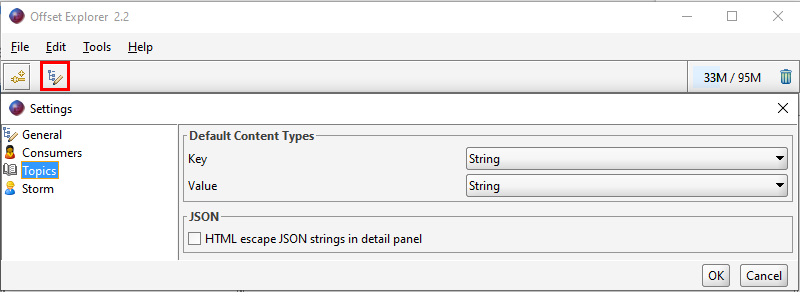
- After this, change the default content types (see Settings -> Topics) to "String" (instead of "Byte Array").
This is necessary so that later the event name and payload are displayed legibly.
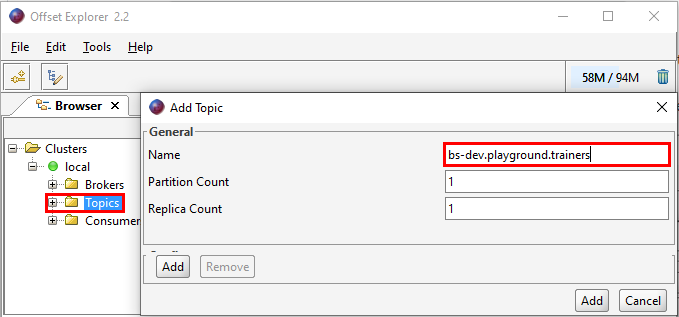
- Finally you need to add the topic you want to listen to in the Offset Explorer (with right-click on "Topics").
The topic you have to use here is the name of the topic (can be found in the Environment page) associated to the topic binding that you have configured for your event.
Create local-bindings for your project
- You need to create a
local-bindings.jsonin your local project folder. For additional information see the documentation.
You have to use the name of the topic binding and the name of the topic in the file to configure it properly. Both information can be found in the Environment page "Topic Bindings" overview.
For our sample project the local-bindings.json looks this way (as you can see, there is a topic binding named trainers and a topic named bs-dev.playground.trainers):
{
  "topicBindings": {
    "trainers": {
      "topicName": "bs-dev.playground.trainers",
      "kafkaBinding": "kafkaconfig"
    }
  },
  "kafkaBindings": {
    "kafkaconfig": {
      "kafka_brokers_sasl": [
        "localhost:29092"
      ]
    }
  }
}
- Finally, you need to add the
local-bindings.jsonto the.gitignore-file.
#local bindings
local-bindings.json
Local debugging
Now you are capable to start with local debugging and discovering whether your implemented events have been published.
The general preconditions for debugging must be fulfilled:
- Setting up debugging for your project and
- Executing
k5 prepare-debug
The debugging itself is actually not different than without events. We refer to the already known chapter of the documentation.
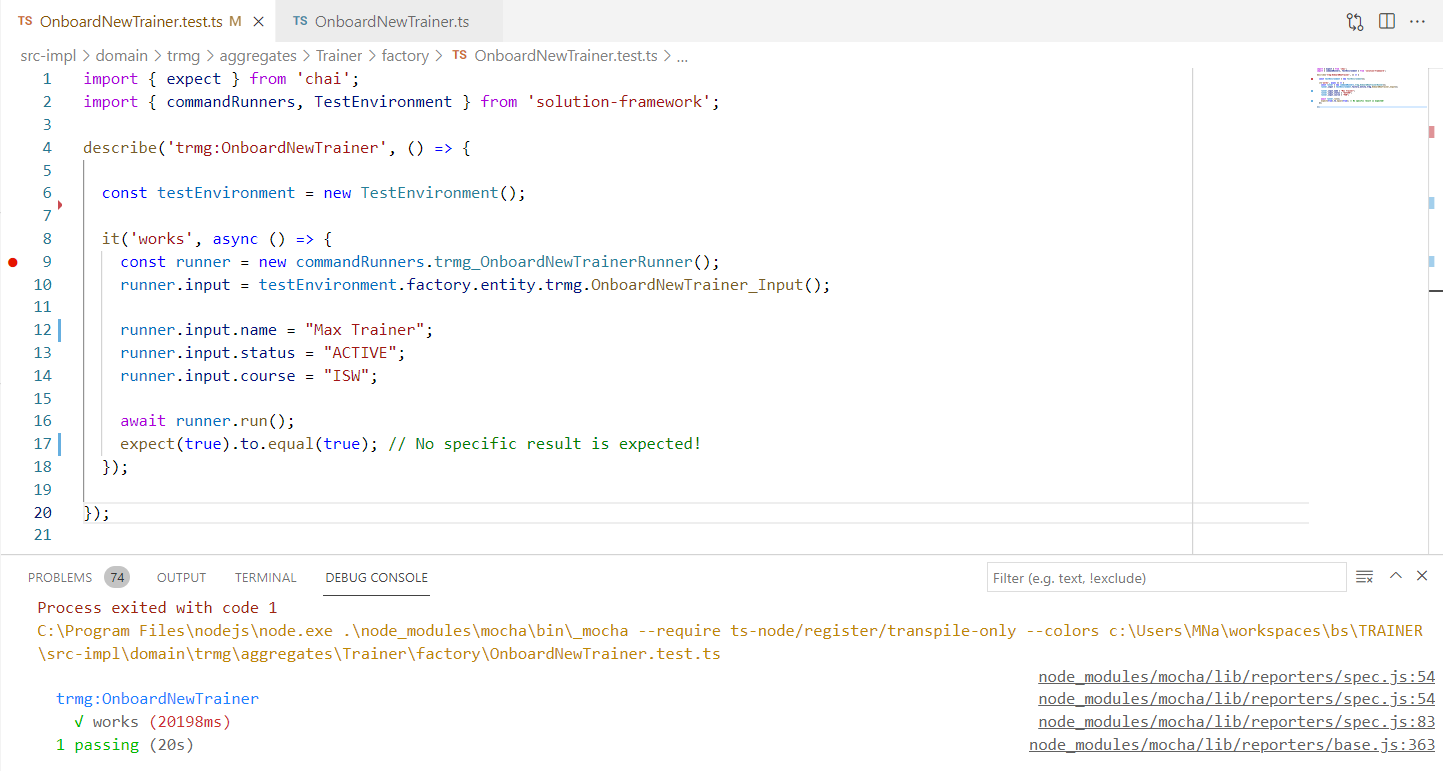
When debugging our test-script (calling the FactoryCommand incl. event publishing), we now get a "passed-result".
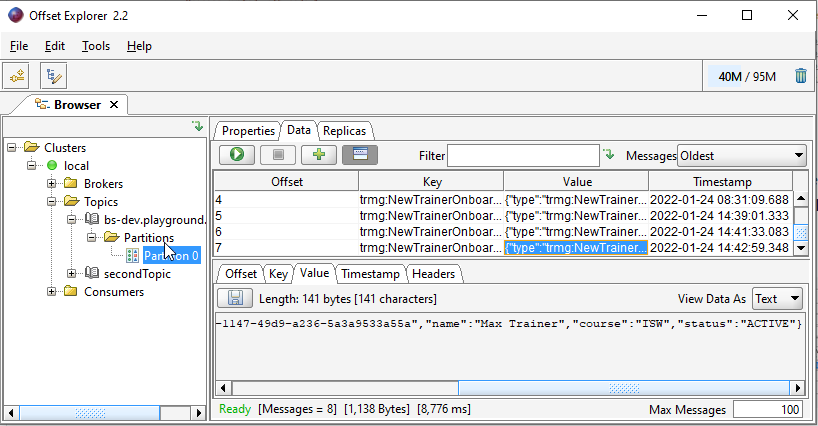
Display Events in Offset Explorer
Finally we want to prove that the event was published to Kafka. Therefore, we need to go the Offset Explorer again, select the topic we are interested in and click on "Partition 0". To show all events for this topic we only need to click on the "Play-Button" above the table - then these will be displayed as shown below.
Although it is possible to publish Events from your local machine, it is not supported that Event-Agents are triggered locally. To trigger agents locally, please use the debug script of the Agent.
Here are some points that may need to be adjusted depending on your setup.
Environment or project specific information
Topics, Topic Bindings etc. depend on the environment and project you are working on. You have to adjust these accordingly.
You are now able to debug your events locally!