Use custom OML Profiles and Project Baselines in Graphical Design
You want to use custom Open Modeling Language (OML) profiles and project baselines in the Graphical Design feature of IBM DevOps Solution Workbench.
Description
This How-To shows you
- how to create a new project from a project baseline
- how to use the available OML profiles in the Graphical Design feature of the workbench
- how defined element types (incl. diagrams), relationship types, properties and status enumerations are embedded in the Graphical Design feature
Prerequisites
- You have already created the project baseline the you want to use in a project.
- The project baseline contains the profiles that you want to use in your project.
- The baseline is already accessible to the IBM DevOps Solution Workbench.
If you need help in creating and uploading your custom project baseline to the Workbench, please check out How-To: Create and edit custom Project Baselines.
Example
We will use the following scenario as an example:
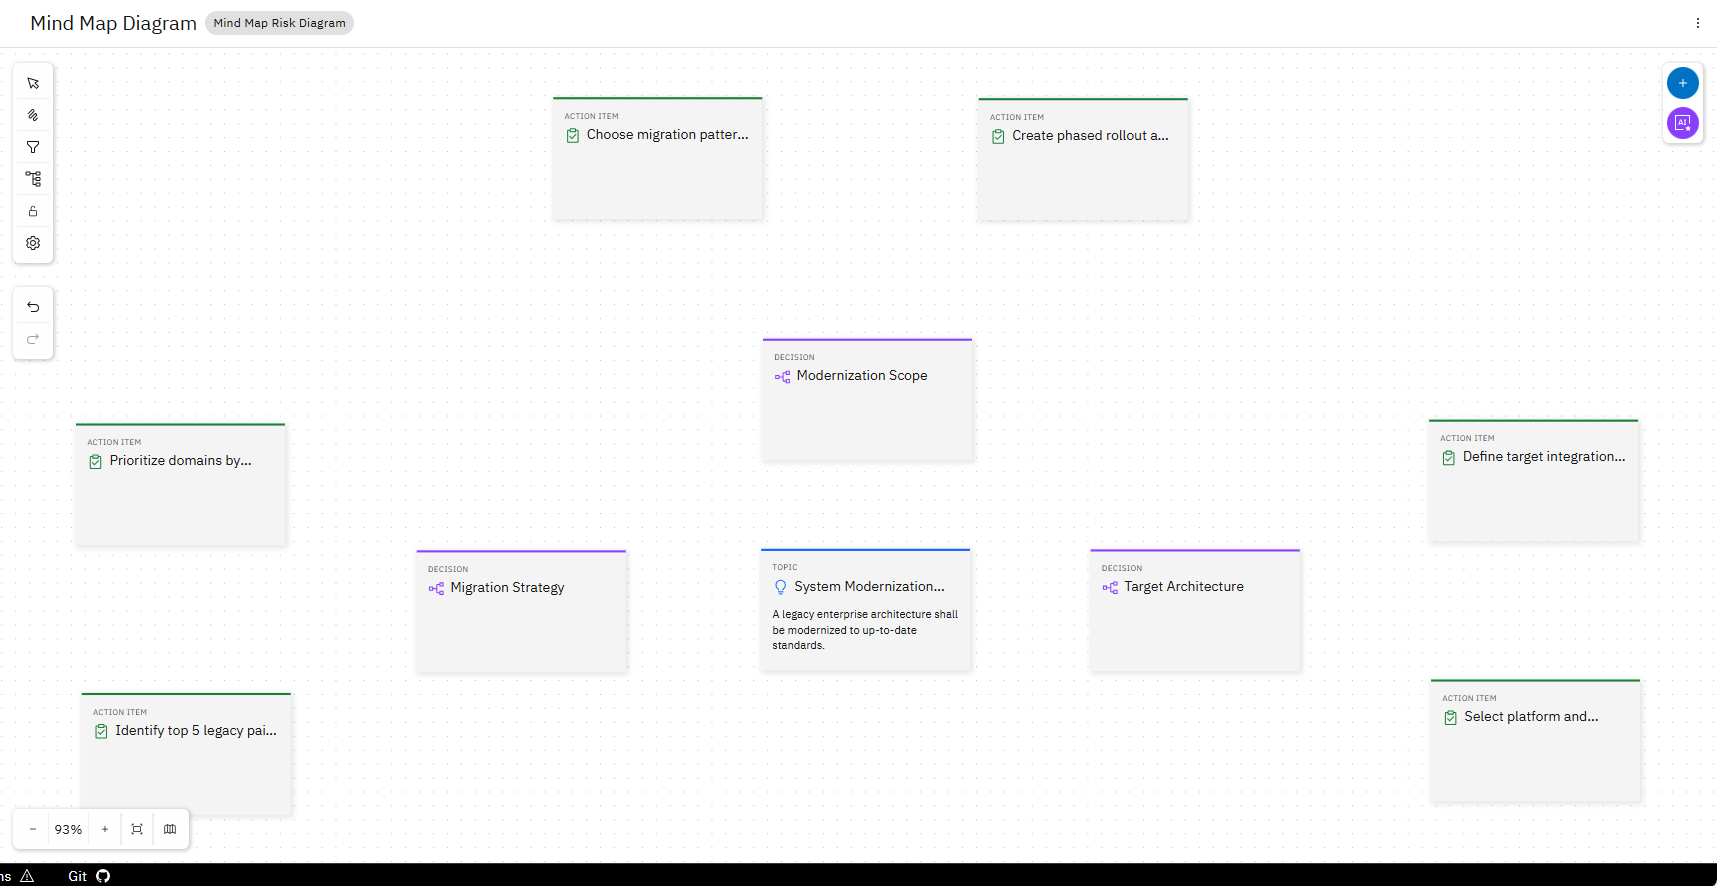
The architecture team is asked to modernize a legacy core system without disrupting business. In a workshop, they have to build a mindmap to move from strategy to concrete actions via the following steps:
1. Frame the challenge.
2. Define strategic decisions.
3. Break decisions into execution actions.
4. Make risks visible.
5. Connect mitigations to risks.
The result is desired to be mindmap of a shared modernization plan with clear ownership, priorities, and timeline.
Before creating the actual mindmap, the team defined the elements and relationships that exist in their mind map:
- The central element of this mind map is the topic or challenge.
- First-level branch elements are the decisions. They give a well-founded strategy on how to approach the challenge.
- Second-level branch elements are action items. They are concrete executable steps based on the decisions.
- Topics can branch into decisions, which can branch into action items.
- Decisions and action items can be dependent on other decisions and action items.
- Potential risks can be mitigated by action items.
Steps
Now comes the part where we actually model the mindmap described above with its elements and relationships in the IBM DevOps Solution Workbench. Therefore, we will use the Solution Designer.
The used OML profile and the project baseline are explained with more detail in How-To: Create and edit custom OML Profiles and How-To: Create and edit custom project baselines.
1. Create a new project from a project baseline
Project Baselines contain a specific set of OML profiles as modeling configuration and can serve as a starting point for new projects. So when selecting a baseline during the project creation process (which is shown below), you basically select the modeling configuration that is available to your project.
First step in the Solution Designer is to create a new project that will contain the later modeled mindmap with its diagrams, model elements and relationships. Therefore, we will assign a suited baseline as a starting point for the project.
In our example, the project baseline to select has the following details:
- Name: Architecture and Design with Mindmap
- Baseline version: 1.0.0
- ID: architecture-and-mindmap (not visible in the card)
And the project details to fill in the form are as follows:
- Acronym: MINDMAPEXMPL (this has to be unique across the Solution Designer)
- Name: Mindmap Project
- Repository group: enablement/playground (you are free to select any of the available repository groups in the dropdown)
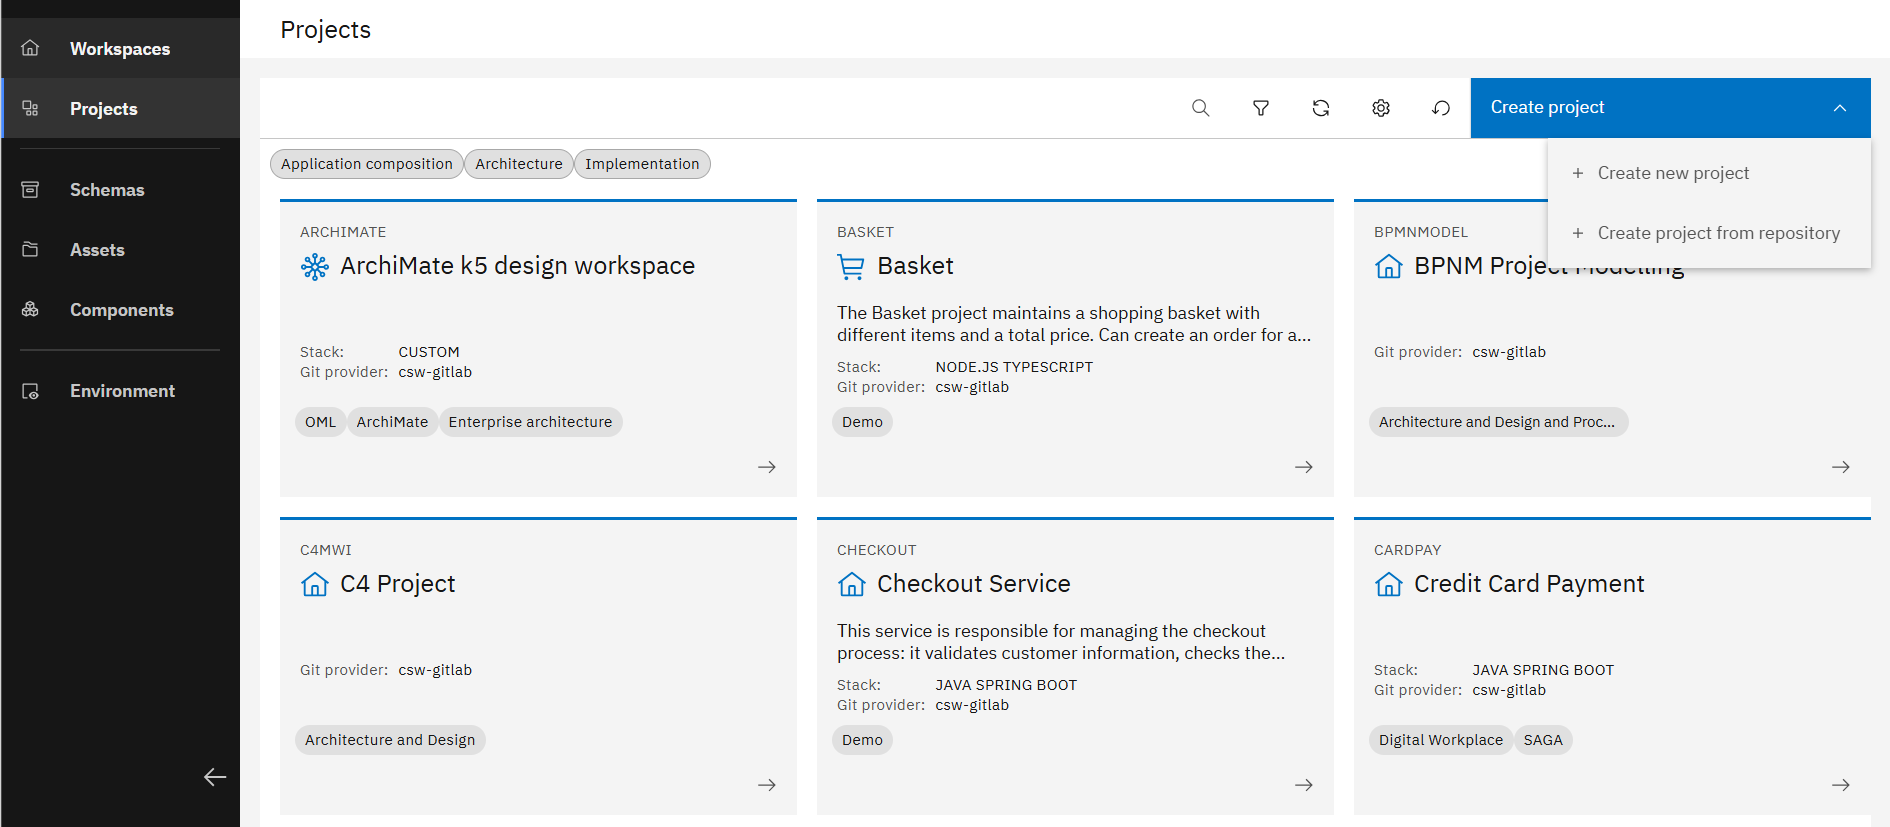
Go to the "Projects" list, click on "Create project" at the top right and then click on "Create new project".
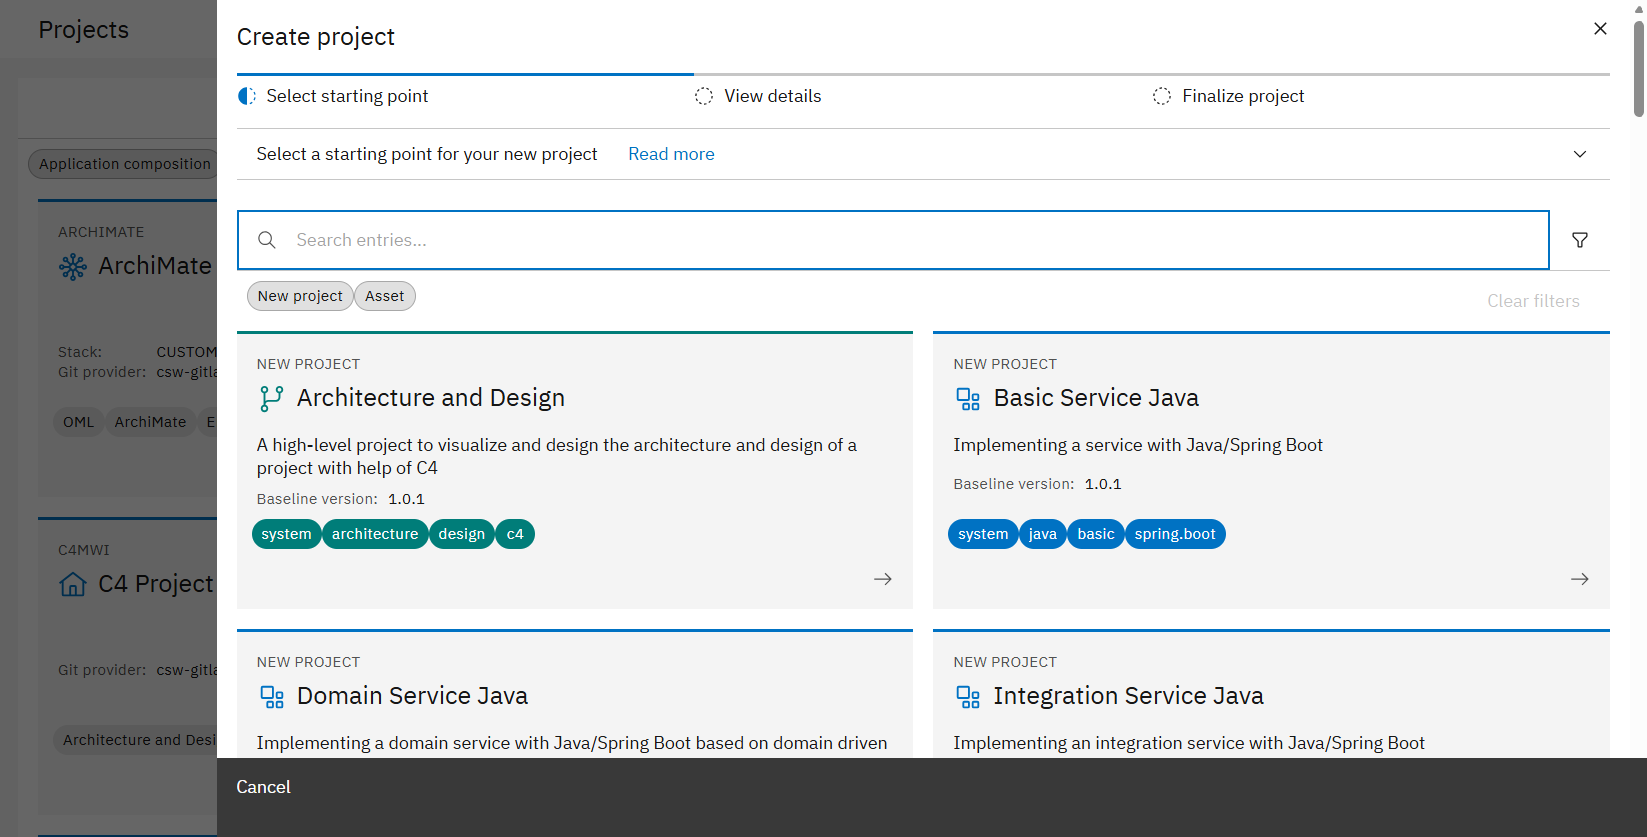
A modal opens where you can select a project baseline. Search for your desired baseline (cf. with above) and click on the corresponding card.
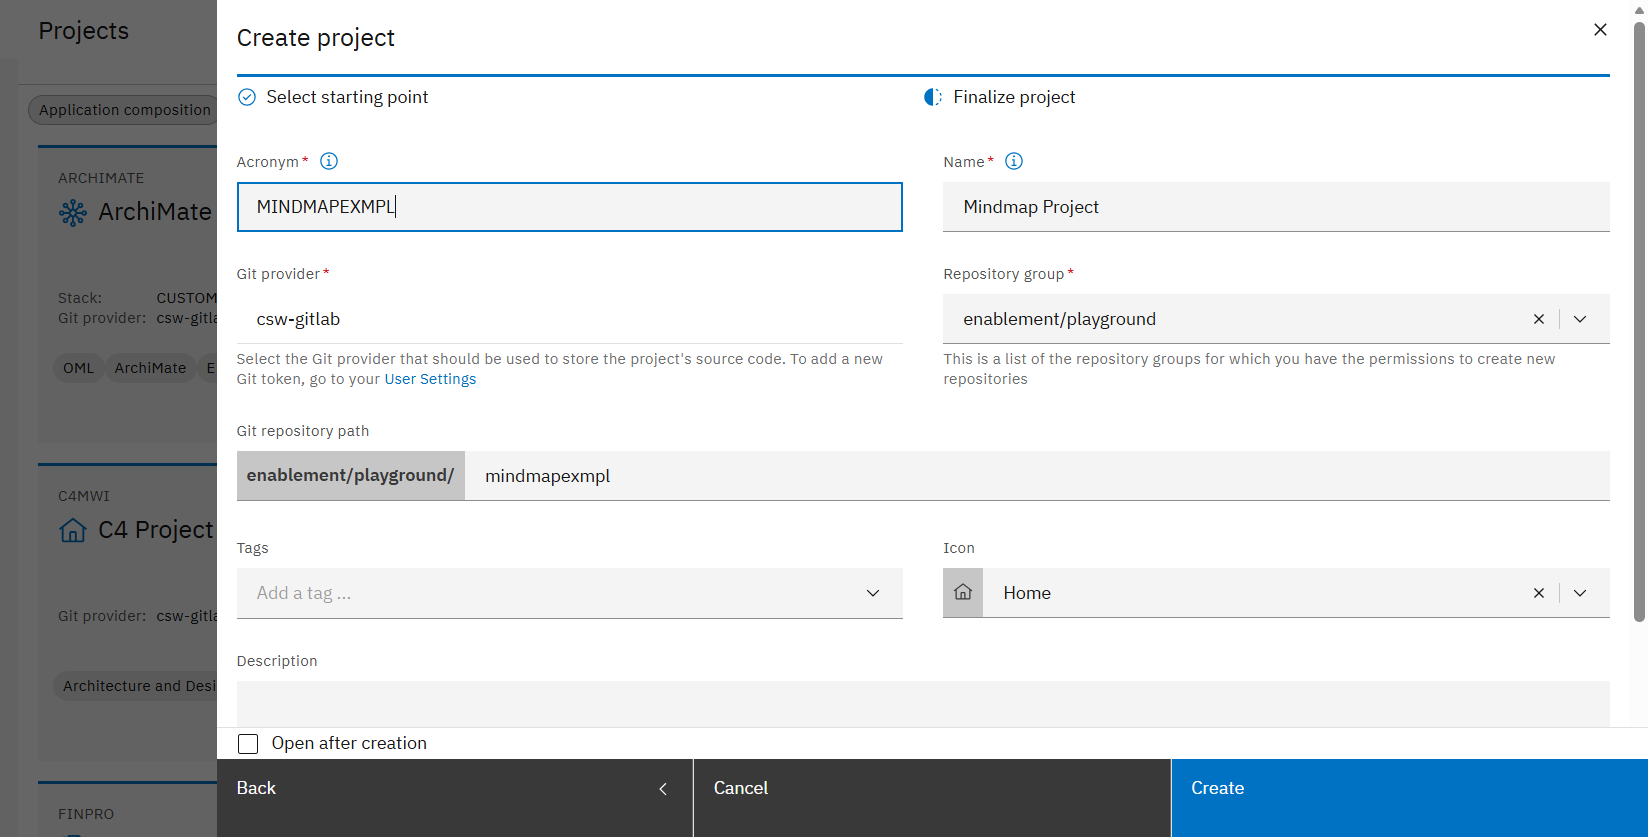
Fill in the necessary project data (cf. with above) and click on "Create".
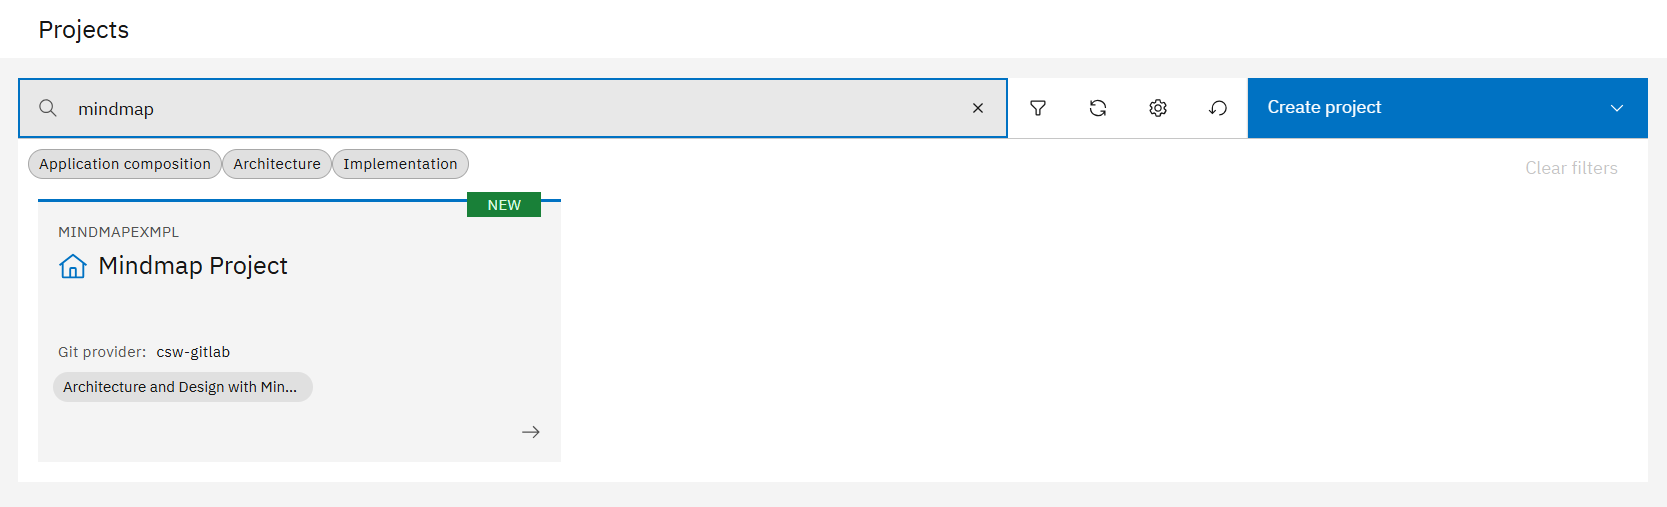
The project is now available in the "Projects" list.
2. Open the project and check its settings
Next, we have to check whether the OML profiles we want to use are enabled in the project. In our example, we want at least the "Mind Map" and "Risks, Tech Debt & Health" profiles to be enabled.
Go to the "Projects" list, search for your created project and click on the corresponding card.
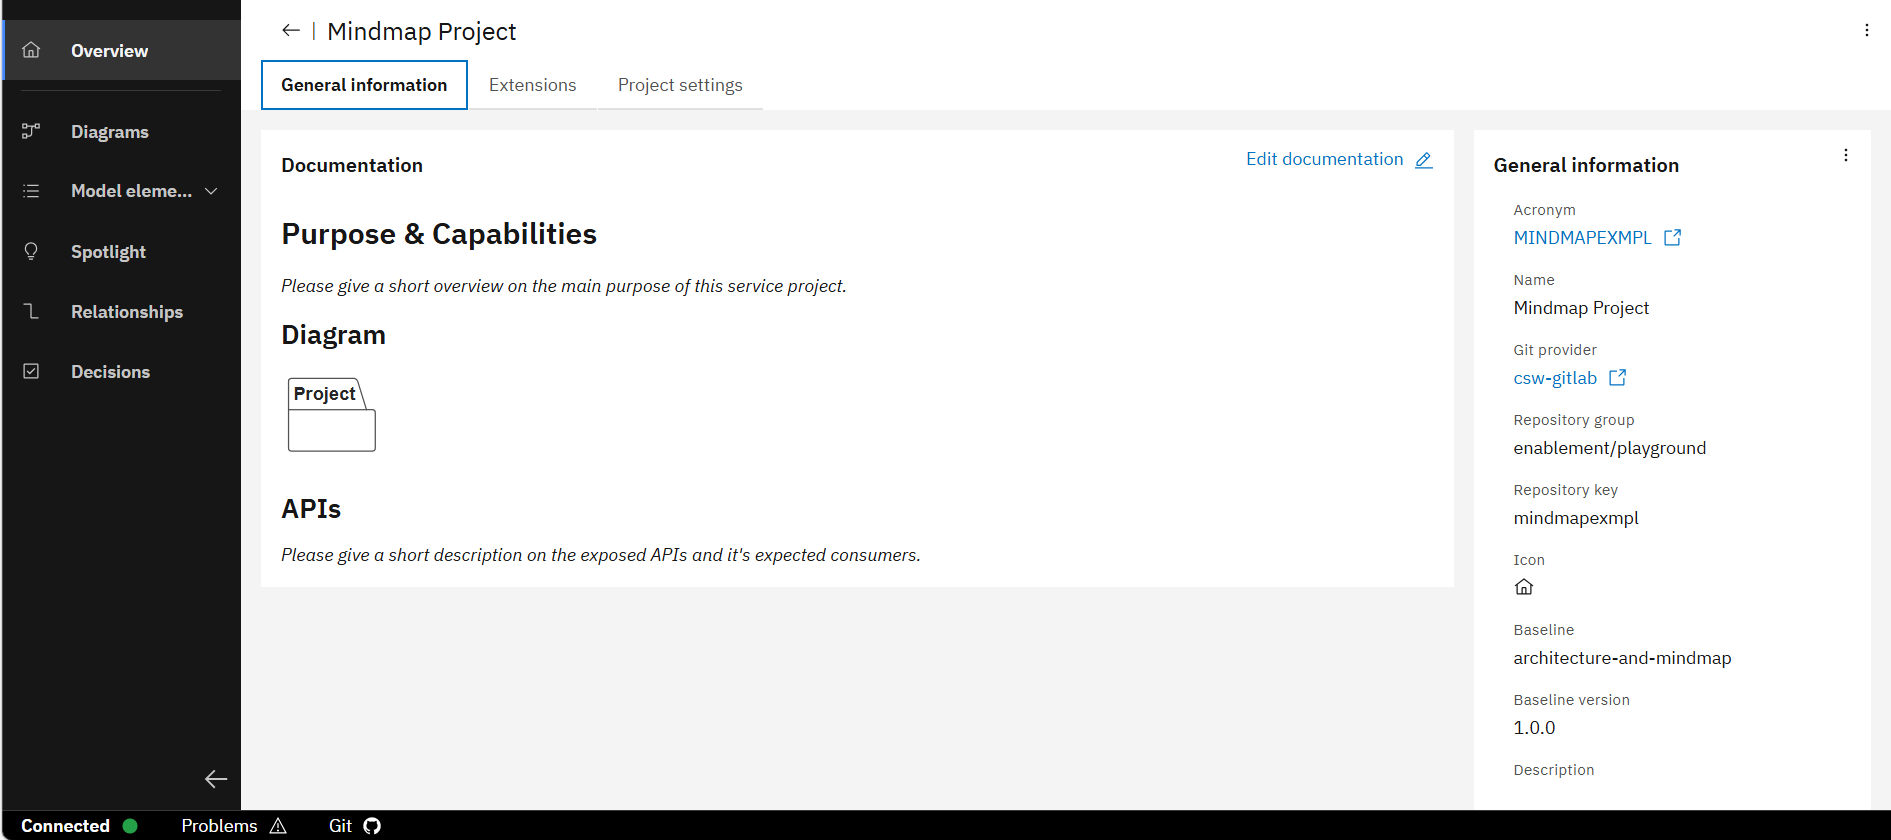
You are in the project overview now. Check out the general information on the right side showing the projects details and the selected baseline.
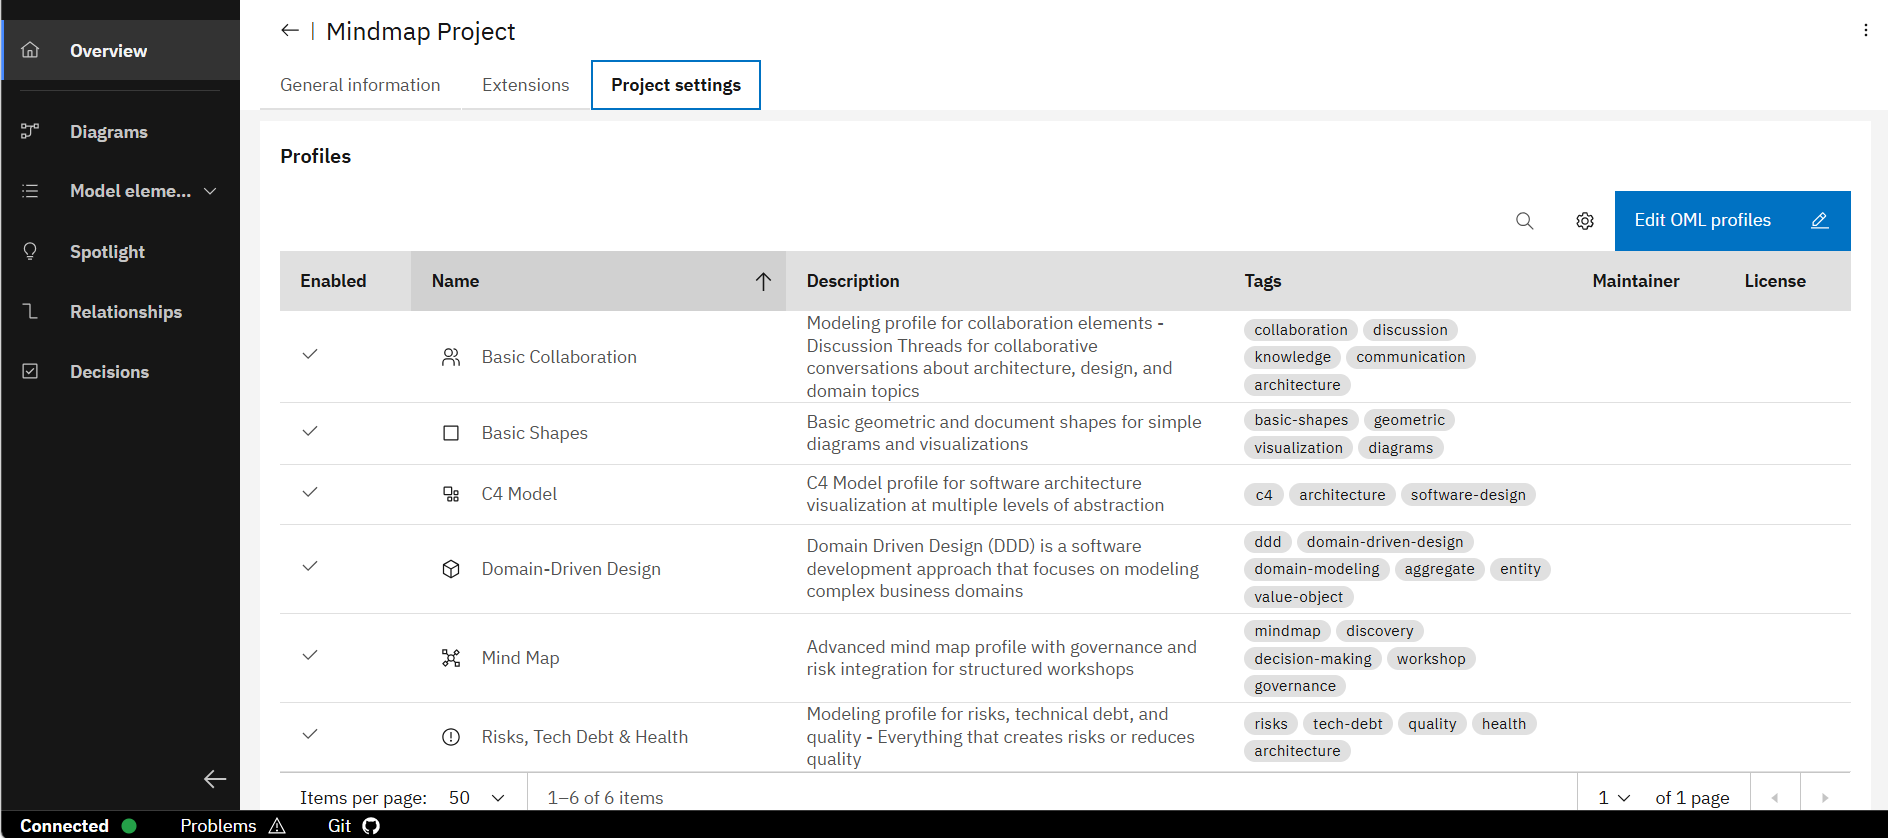
Switch to tab "Project settings" which shows all available OML profiles and whether they are enabled. If your desired OML profile is not enabled, click on "Edit OML profiles" at the top right.
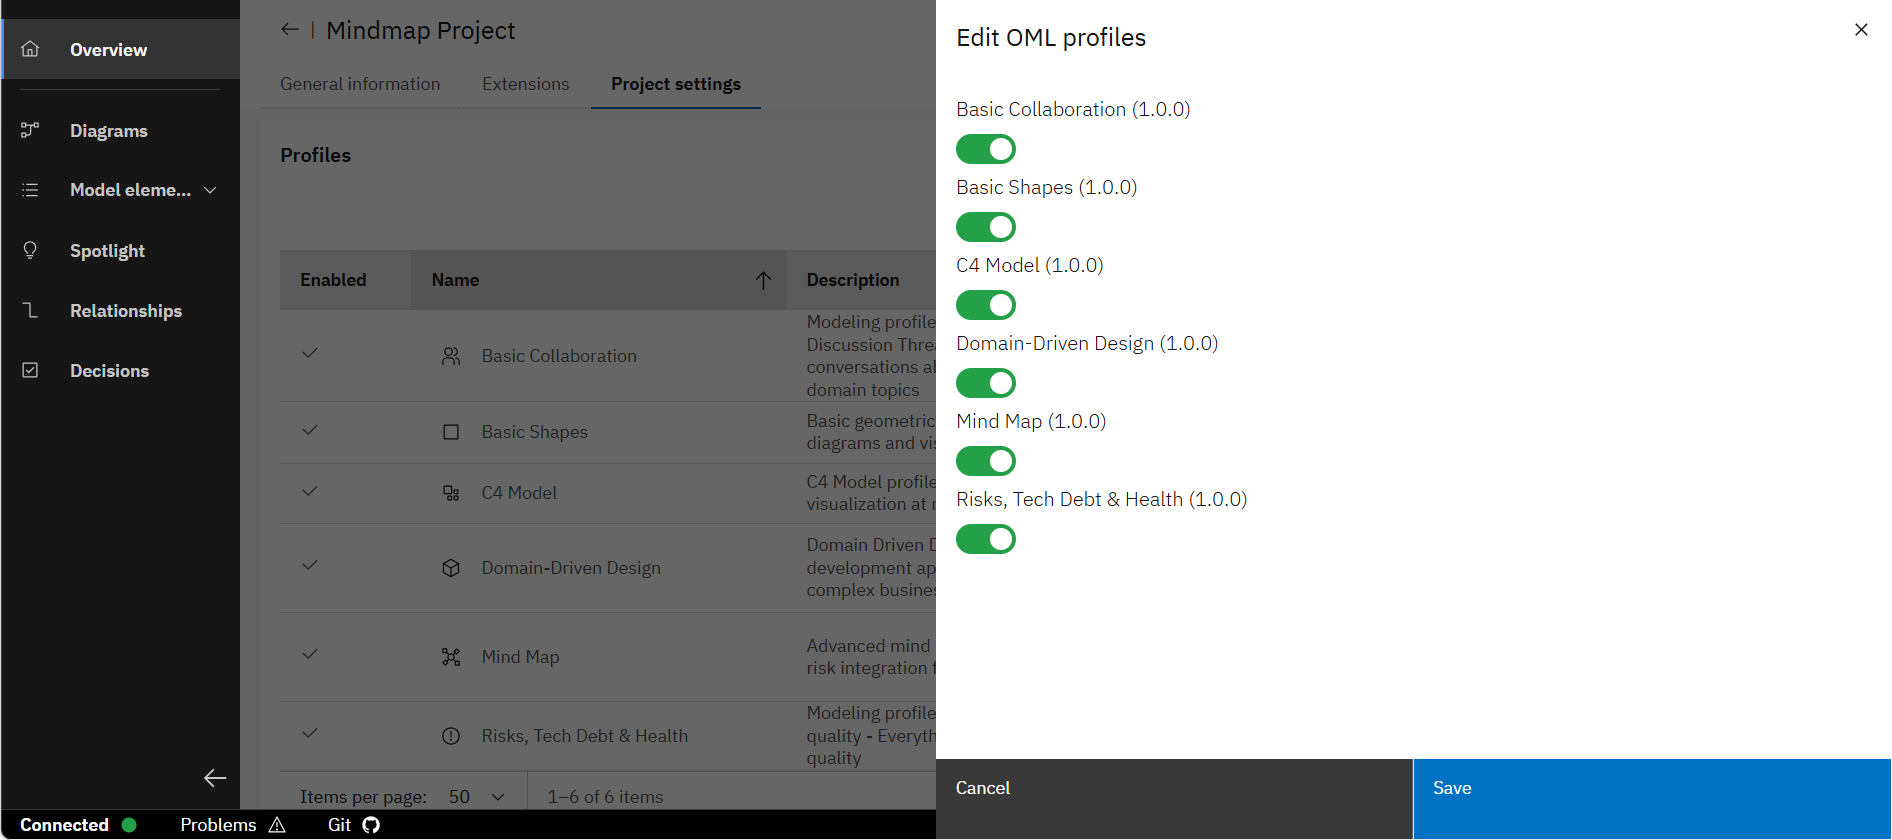
A modal opens with all available OML profiles. There you can enable or disable the OML profiles you want to use.
3. Use your custom OML profiles in the Graphical Design feature
Now that we have enabled the desired OML profiles in the project, we can use them in the Graphical Design feature of the IBM DevOps Solution Workbench.
Create a new diagram
The workbench offers the capability to create diagrams of different types (which are defined in OML profiles). Diagrams help in visualizing the model elements and their relationships in a graphical way. You can visualize any kind of model, e.g. visualize the static structure of a system or, like in our example, a modernization strategy of a legacy software system as a mindmap.
Therefore, we create a new diagram of type "Mind Map Risk Diagram". The diagram details to fill in the form are as follows:
- Type: Mind Map Risk Diagram
- Label: Mind Map Diagram
- File name: mind-map-diagram
- Summary: A specialized diagram with mind map and risk elements.
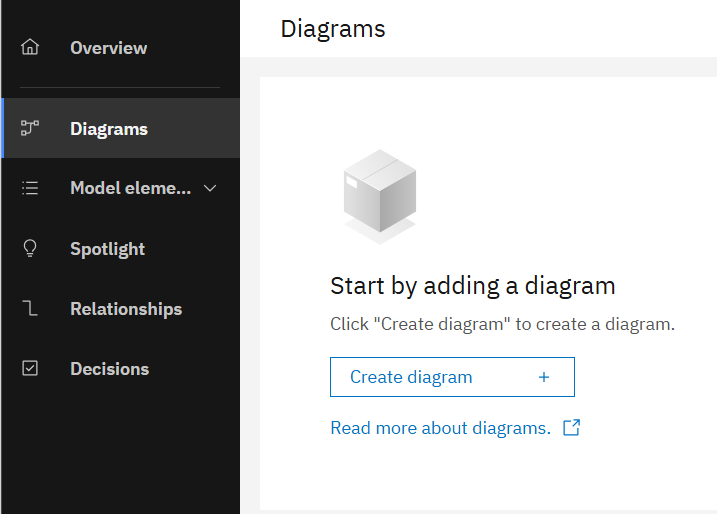
Go to the "Diagrams" list, then click on "Create diagram".
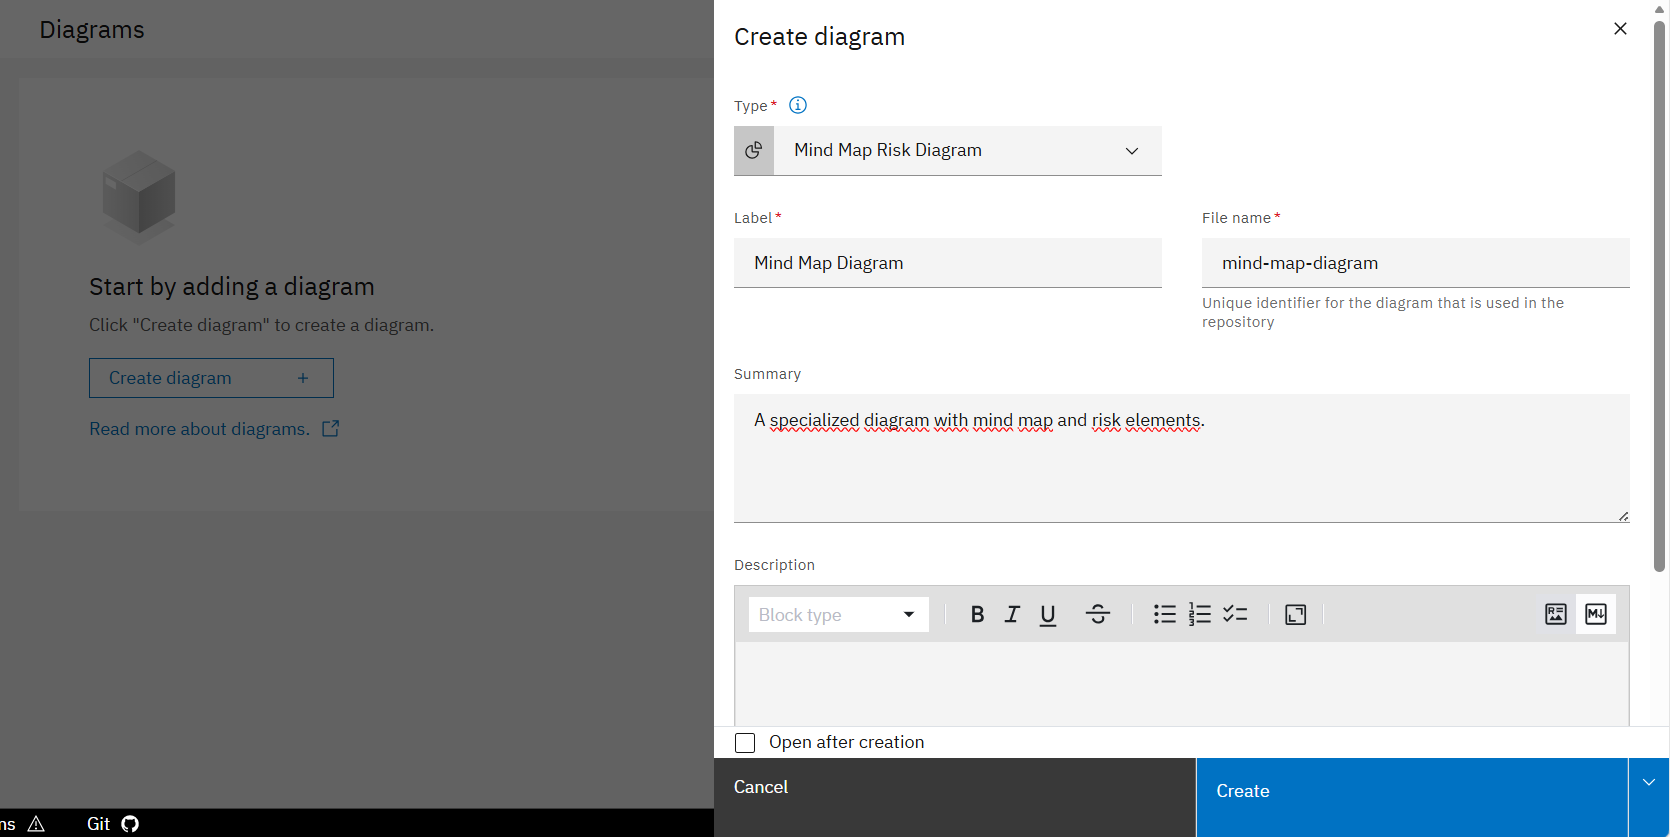
Fill in the necessary diagram data (cf. with above) and click on "Create".
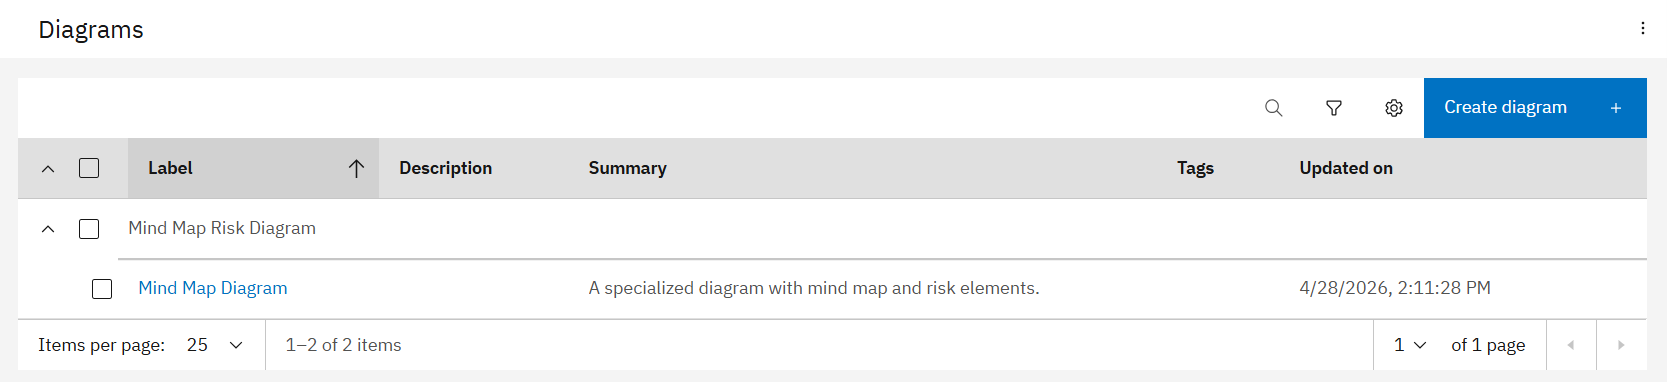
The diagram is now available in the "Diagrams" list.
Create a new model element
After creating a new diagram, you are able to fill its content through the modeling canvas. For more information regarding the modeling canvas, please check the Product Documentation - Modeling Canvas.
You can add model elements through the modeling canvas. Exemplary, the "topic" element is created now as follows:
Go to the "Diagrams" list and click on the diagram item you just created to open its modeling canvas.
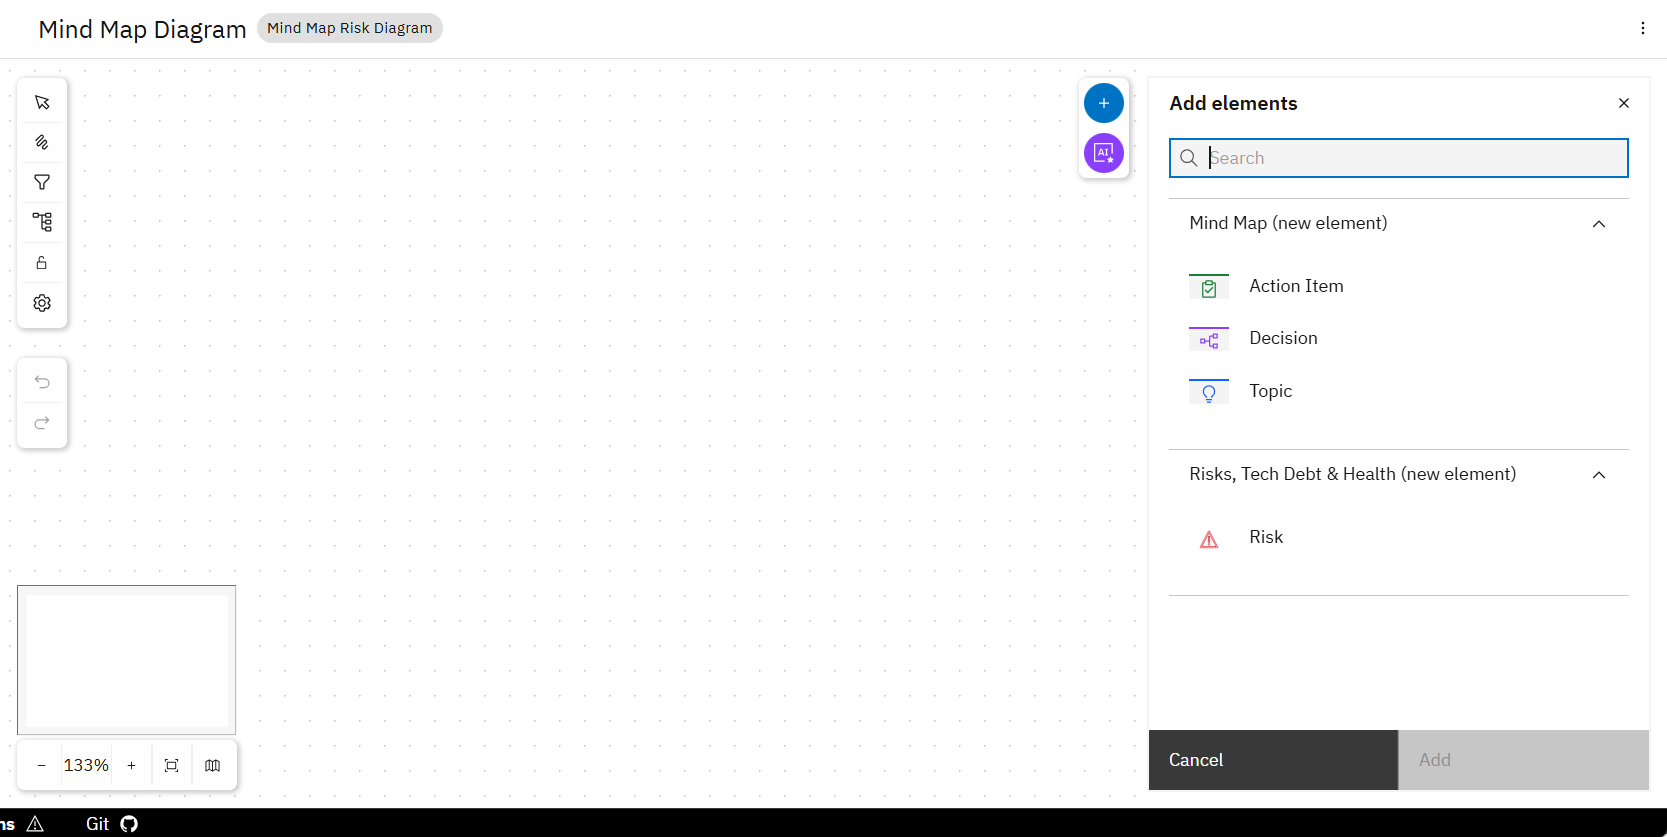
To add a new model element, click on "+" at the top right. A modal opens where you can view all available model elements. Click on "Topic".
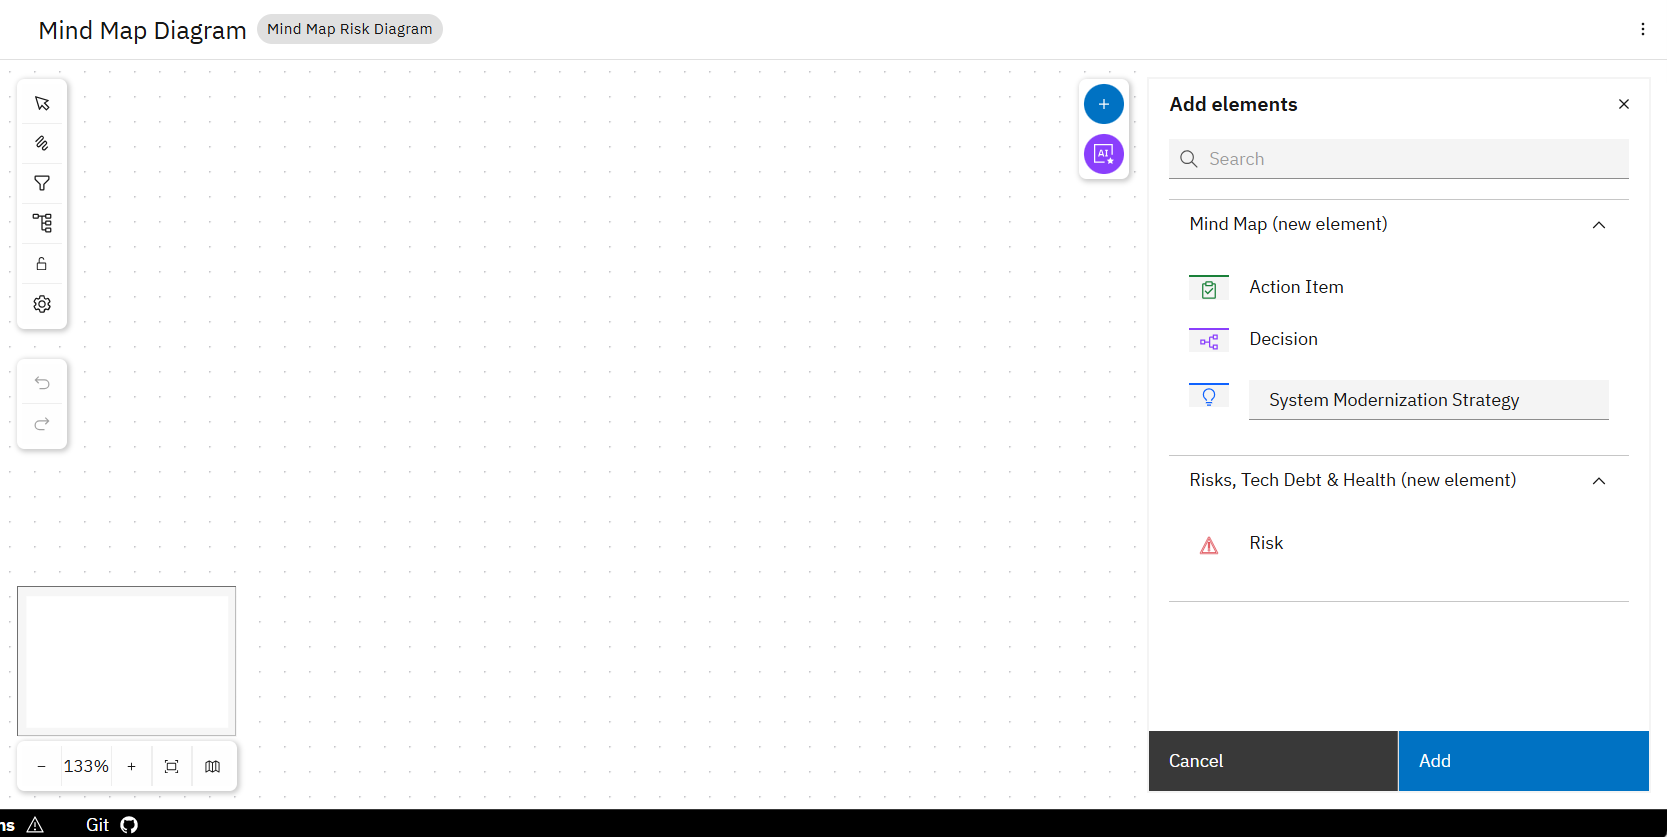
The element type text changes to a text input field where you can type in the element label. Then click on "Add".
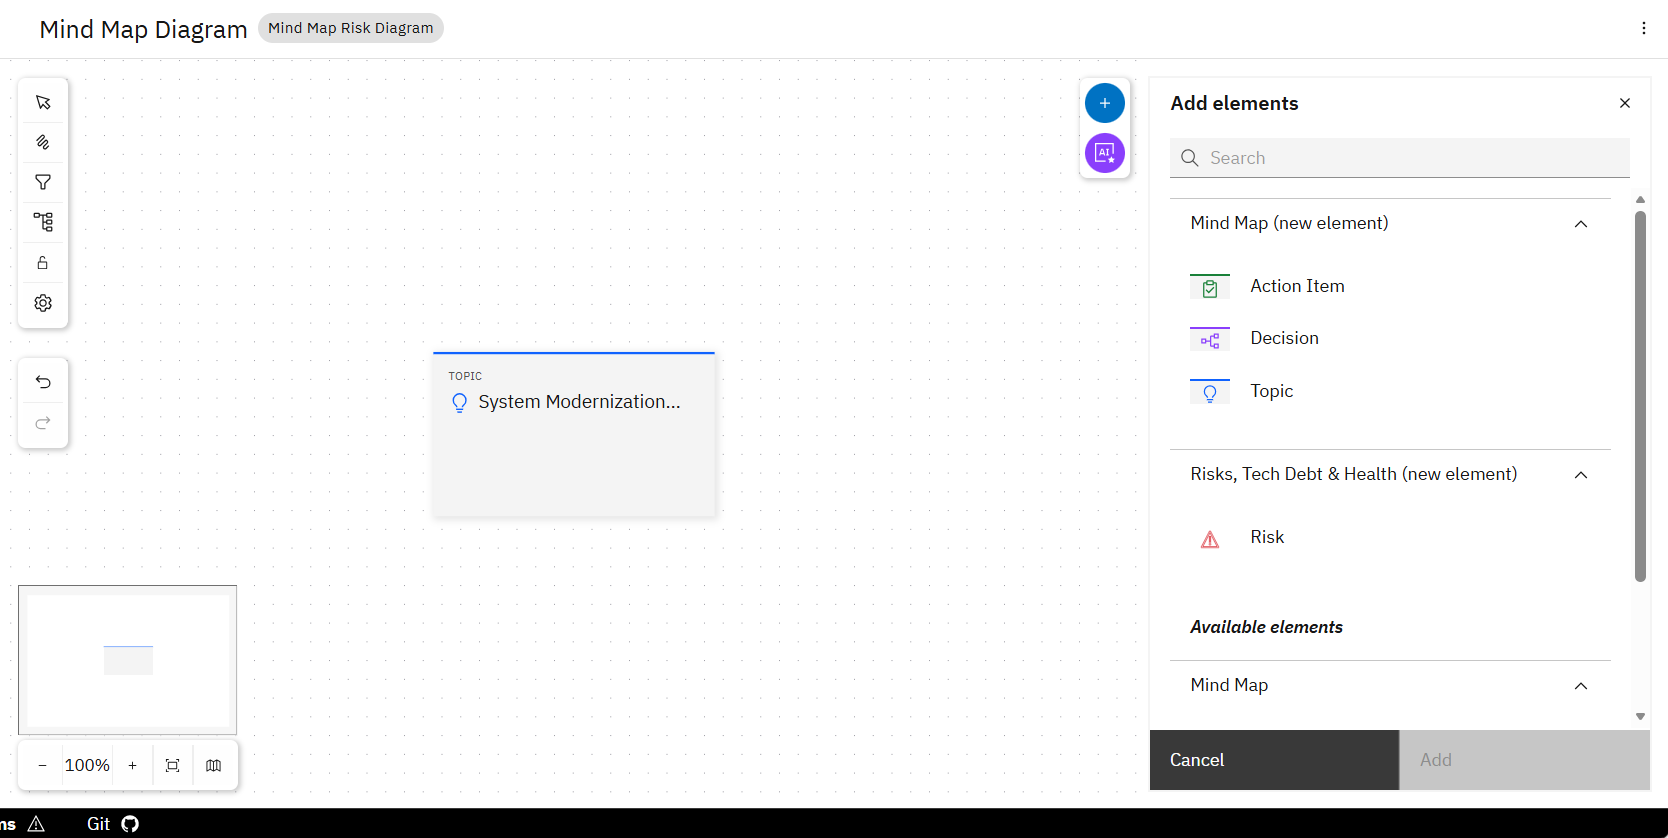
The model element is now visible in the diagram.
In general, you are able to add and edit model elements outside of a diagram and its modeling canvas. Here, we will not focus on that. For more information regarding model elements in the Graphical Design feature, please check out Product Documentation - Model Elements.
Set model element properties
The modeling canvas offers the capability to edit model element properties in a sidebar.
In our example, we will set the "topic" element properties as follows:
- Label: Topic
- Summary: A legacy enterprise architecture shall be modernized to up-to-date standards.
- Description (as Markdown):
## Context

An enterprise architecture became outdated in various aspects.

## Goal

Modernize the legacy platform in phased releases with minimal service disruption. - Status: Draft
- Domain: Enterprise Architecture
- Goal: Modernize the legacy platform in phased releases with minimal service disruption.
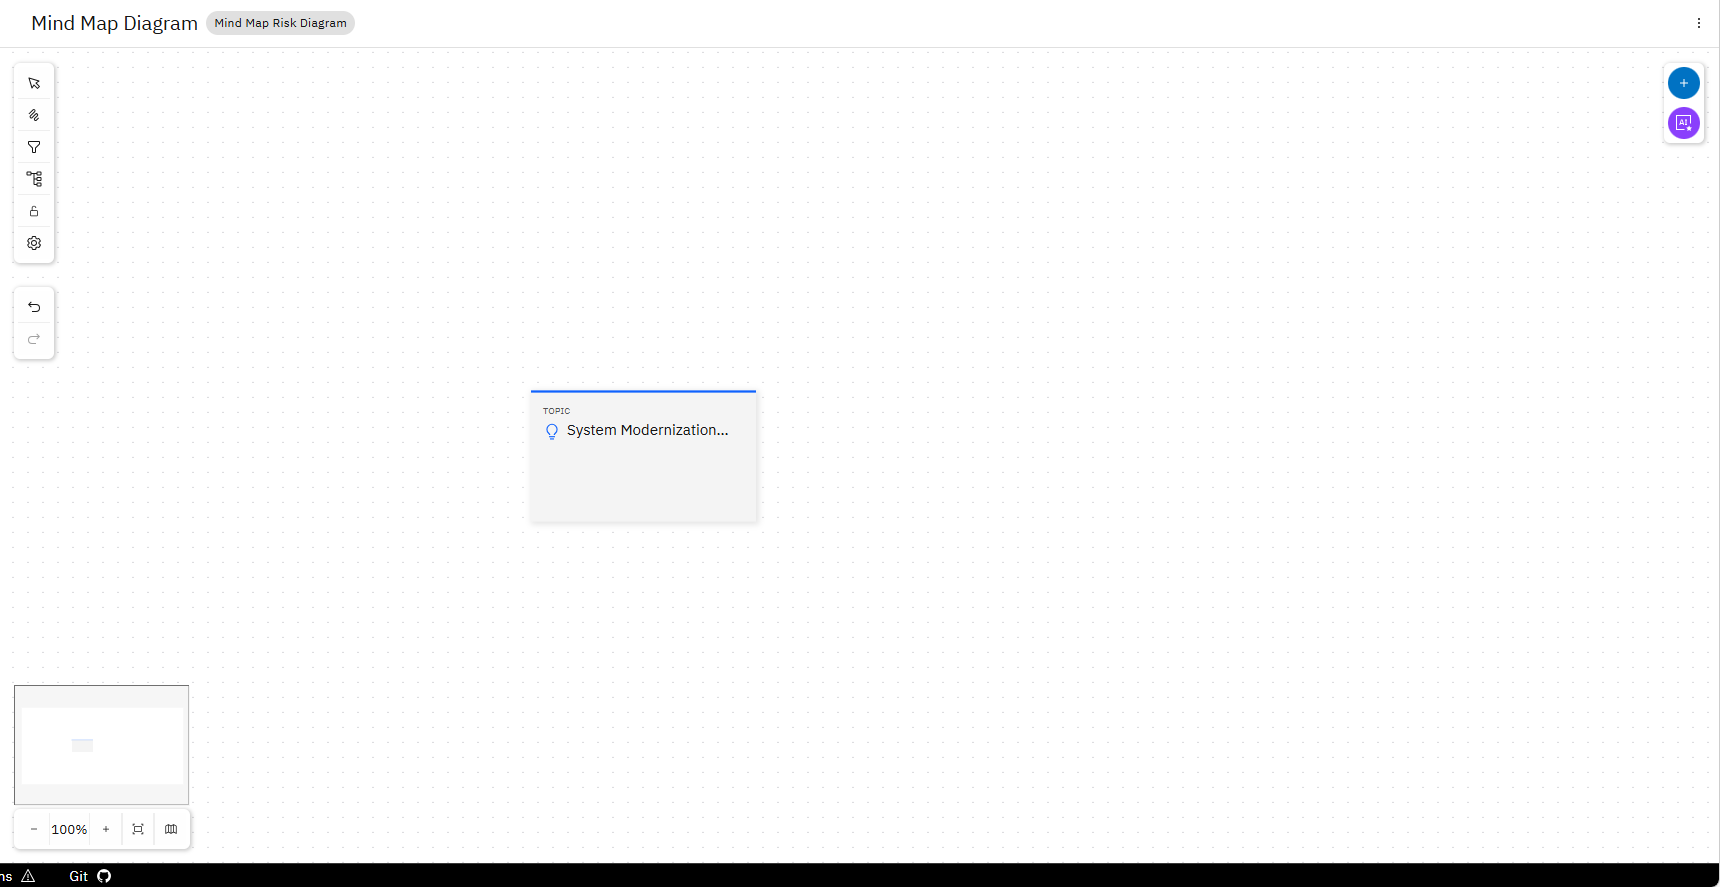
Click on the model element you just created.
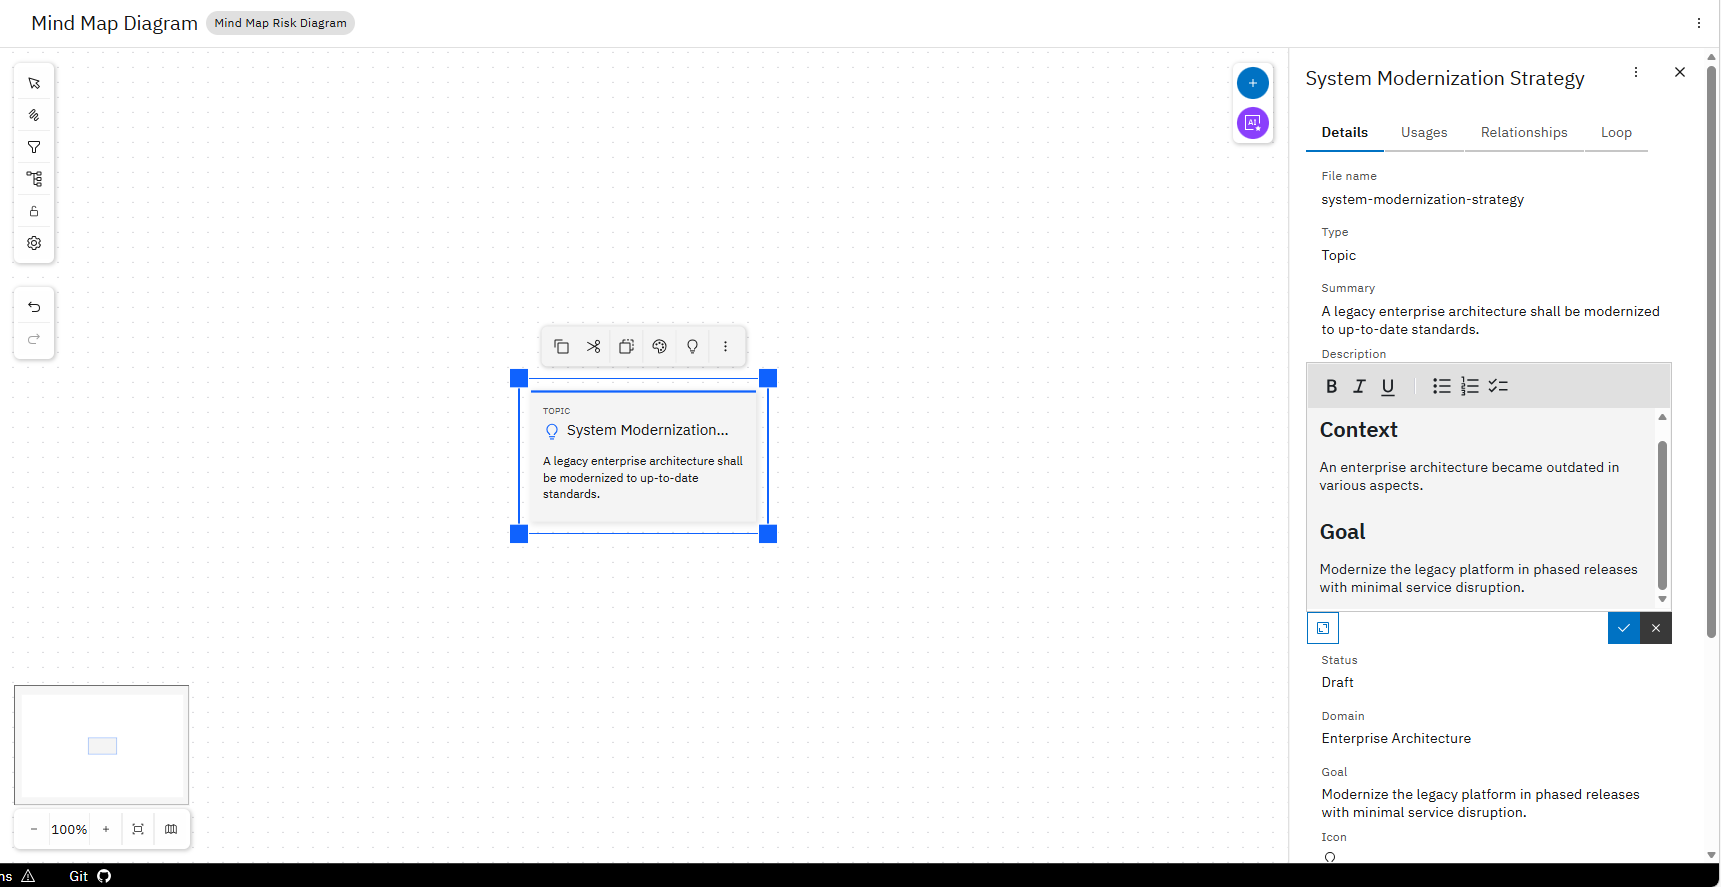
A sidebar opens. Then add or modify the property values you want to define (cf. with above).
After adding more model elements, the mindmap could look like this:
Create a new relationship
After creating model elements, you are able to create relationships between them through the modeling canvas. Exemplary, a "depends-on" relationship is created now as follows:
Hover over the handle (a small circle in the middle of the cards edges) of the desired relationship's source element. Then click and hold the pressed mouse button and move the mouse until you reach the handle of the desired relationship's target element.
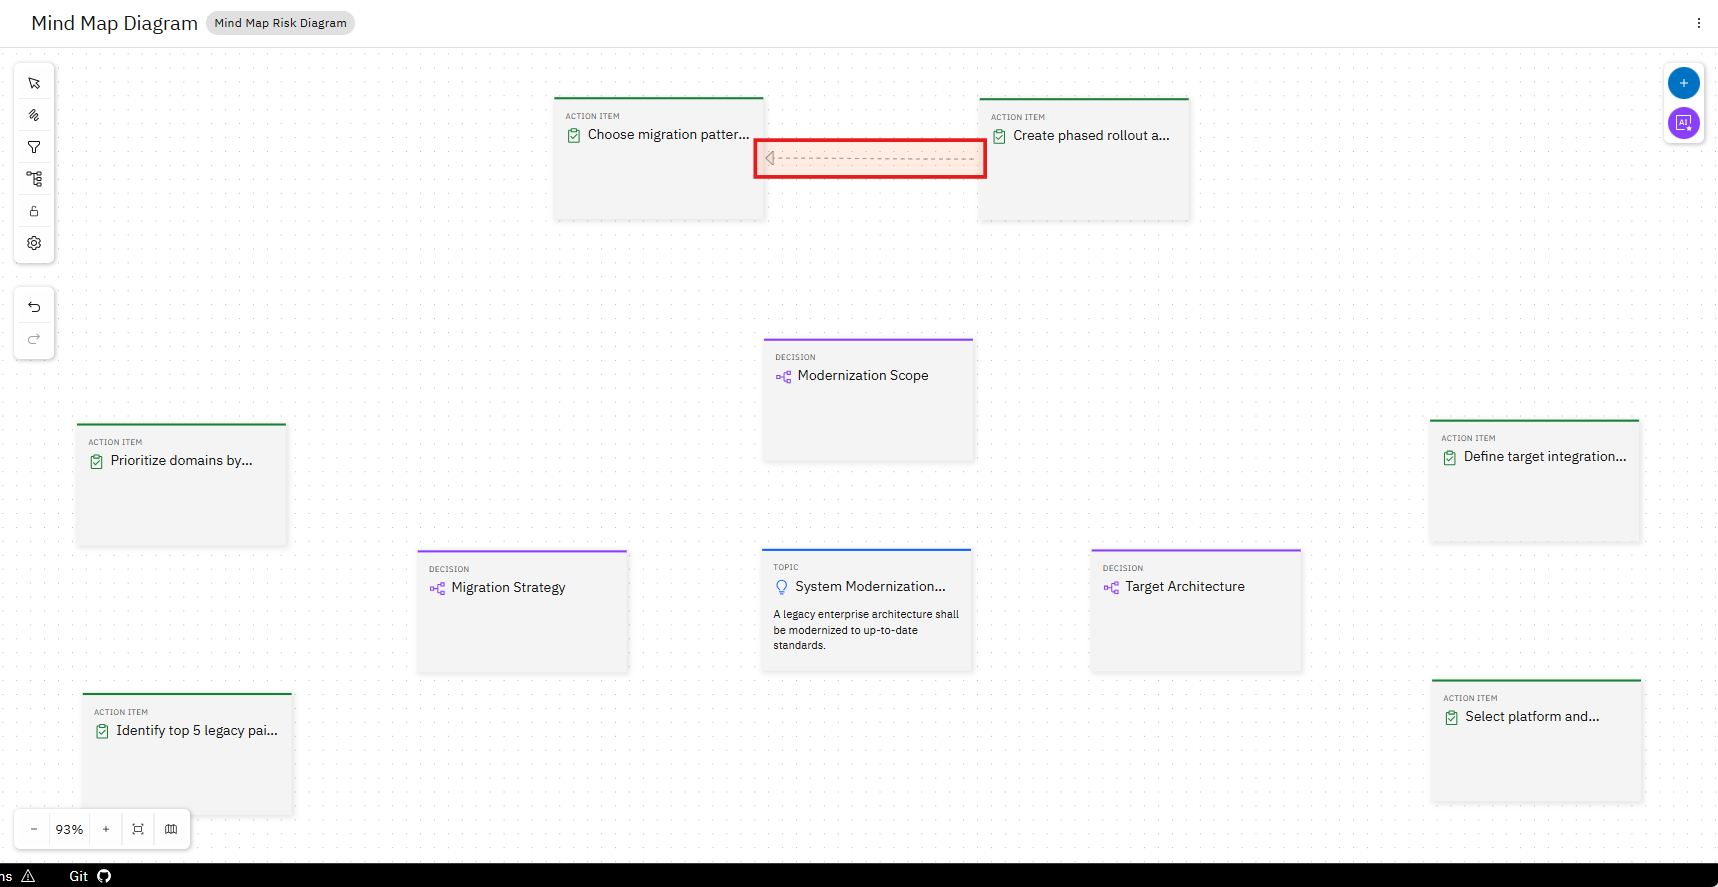
You have created a new relationship (marked in the red box) that is visible in the modeling canvas.
In contrast to model elements, you can only create relationships inside of a diagram and its modeling canvas. But you are able to edit existing relationships inside and outside the modeling canvas. For more information regarding relationships in the Graphical design feature, please check out Product Documentation - Relationships.
Set relationship properties
In our example, we will set the "depends-on" relationship properties as follows:
- Label: depends on
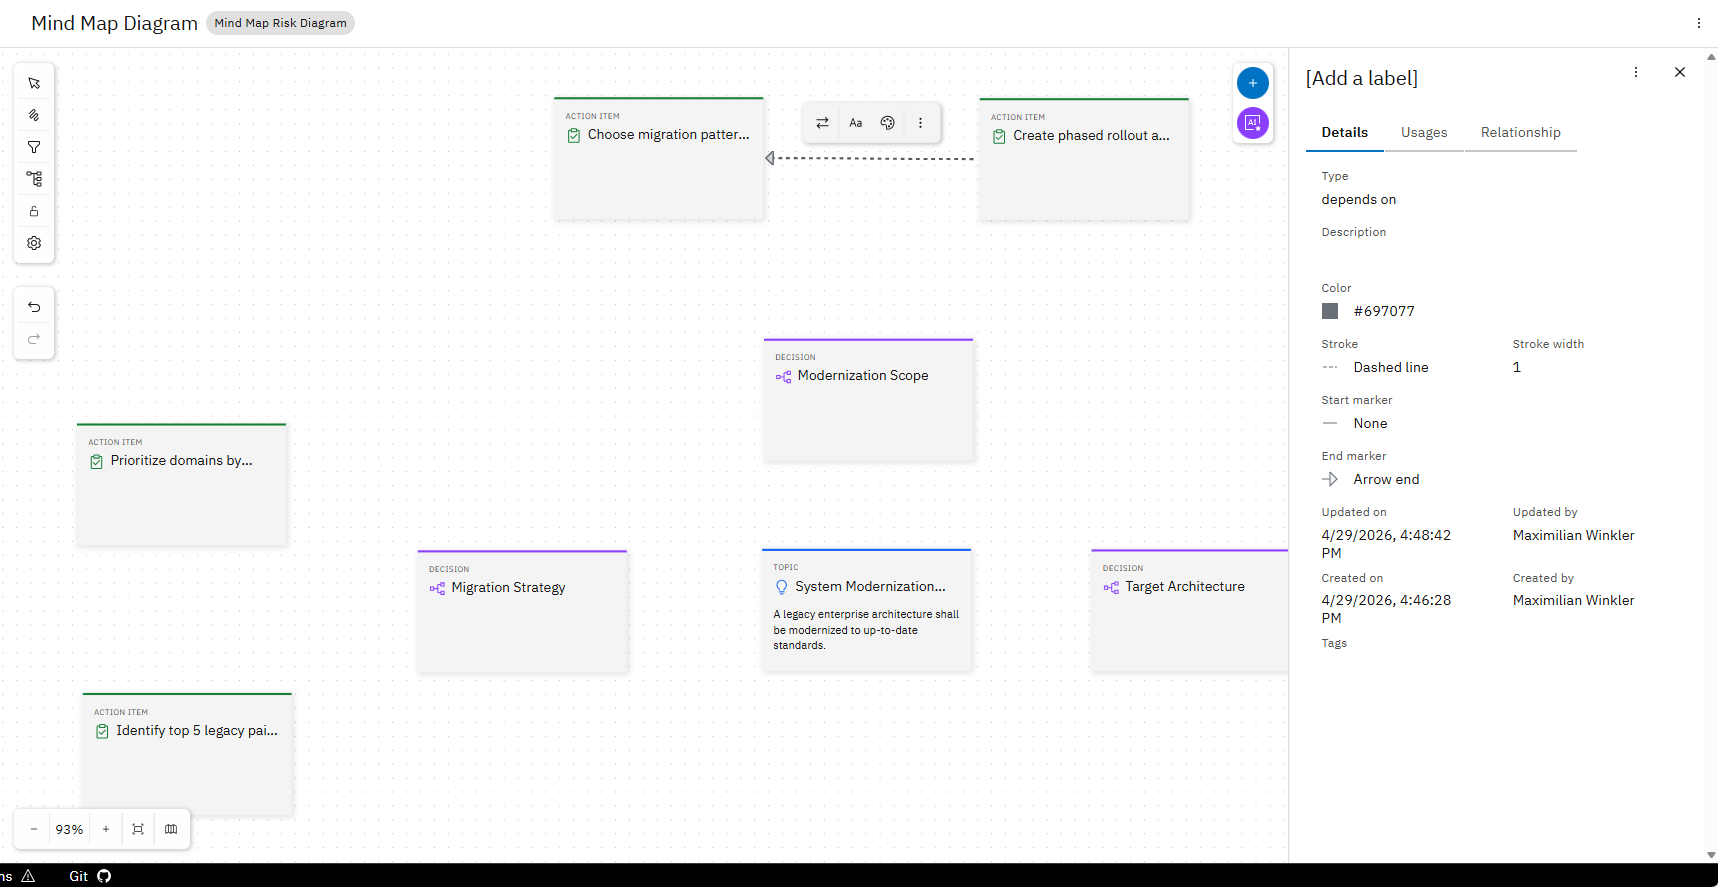
Click on the relationship you just created.
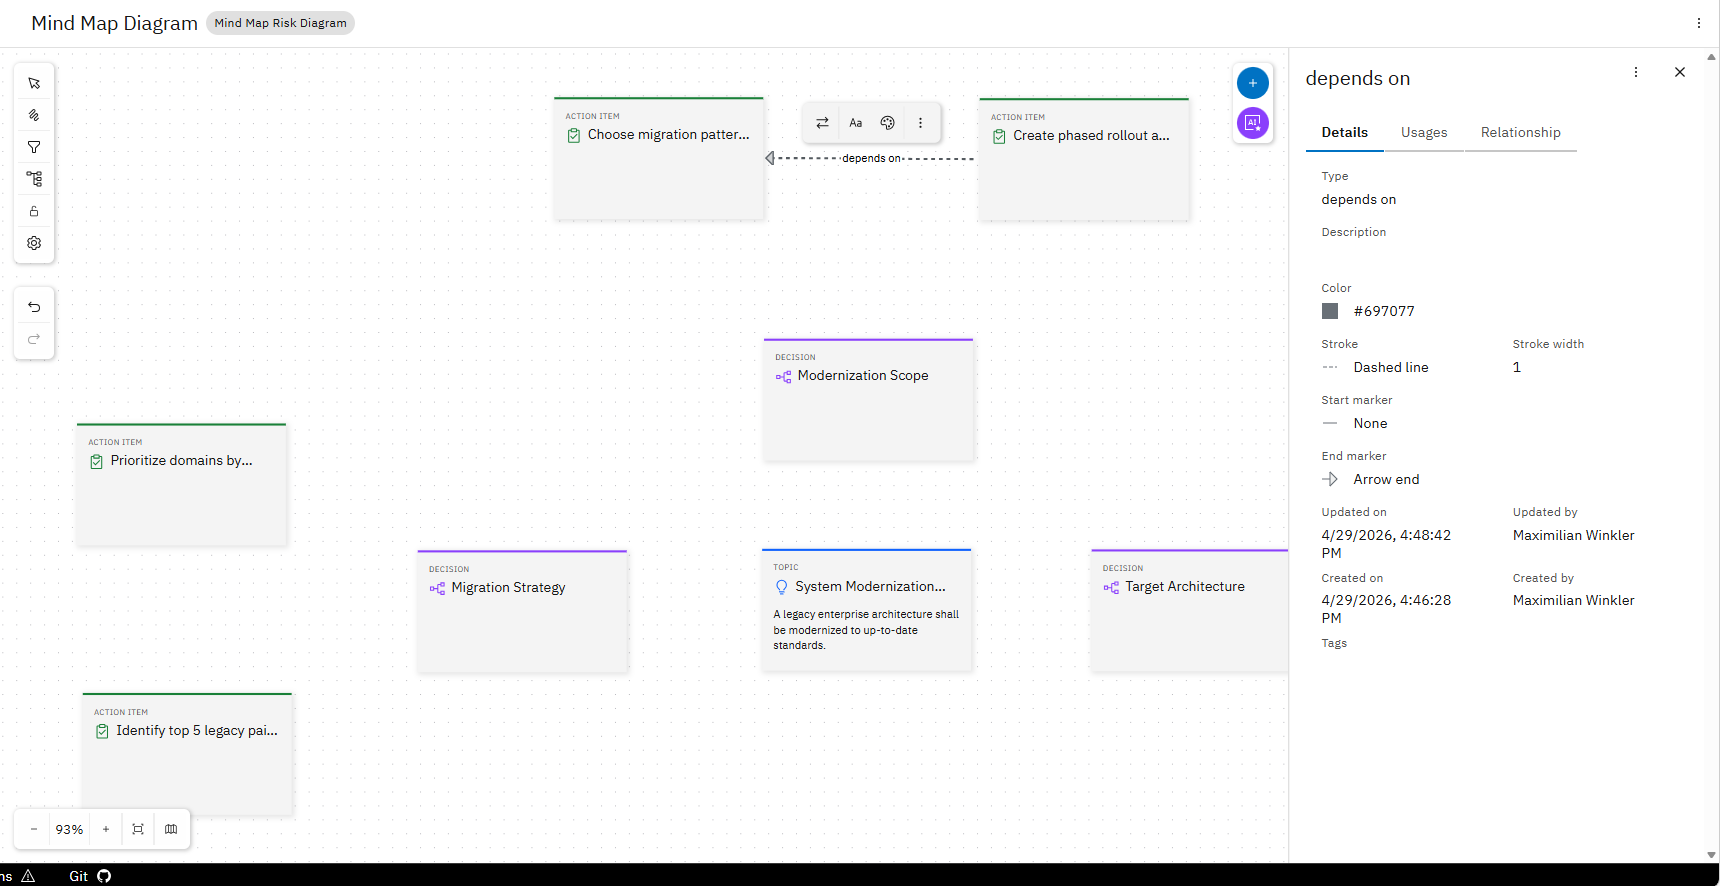
A sidebar opens. Then add or modify the property values you want to define (cf. with above).
Complete diagram
After adding more relationships, the complete mindmap incl. risk elements from another OML profile could look like this:
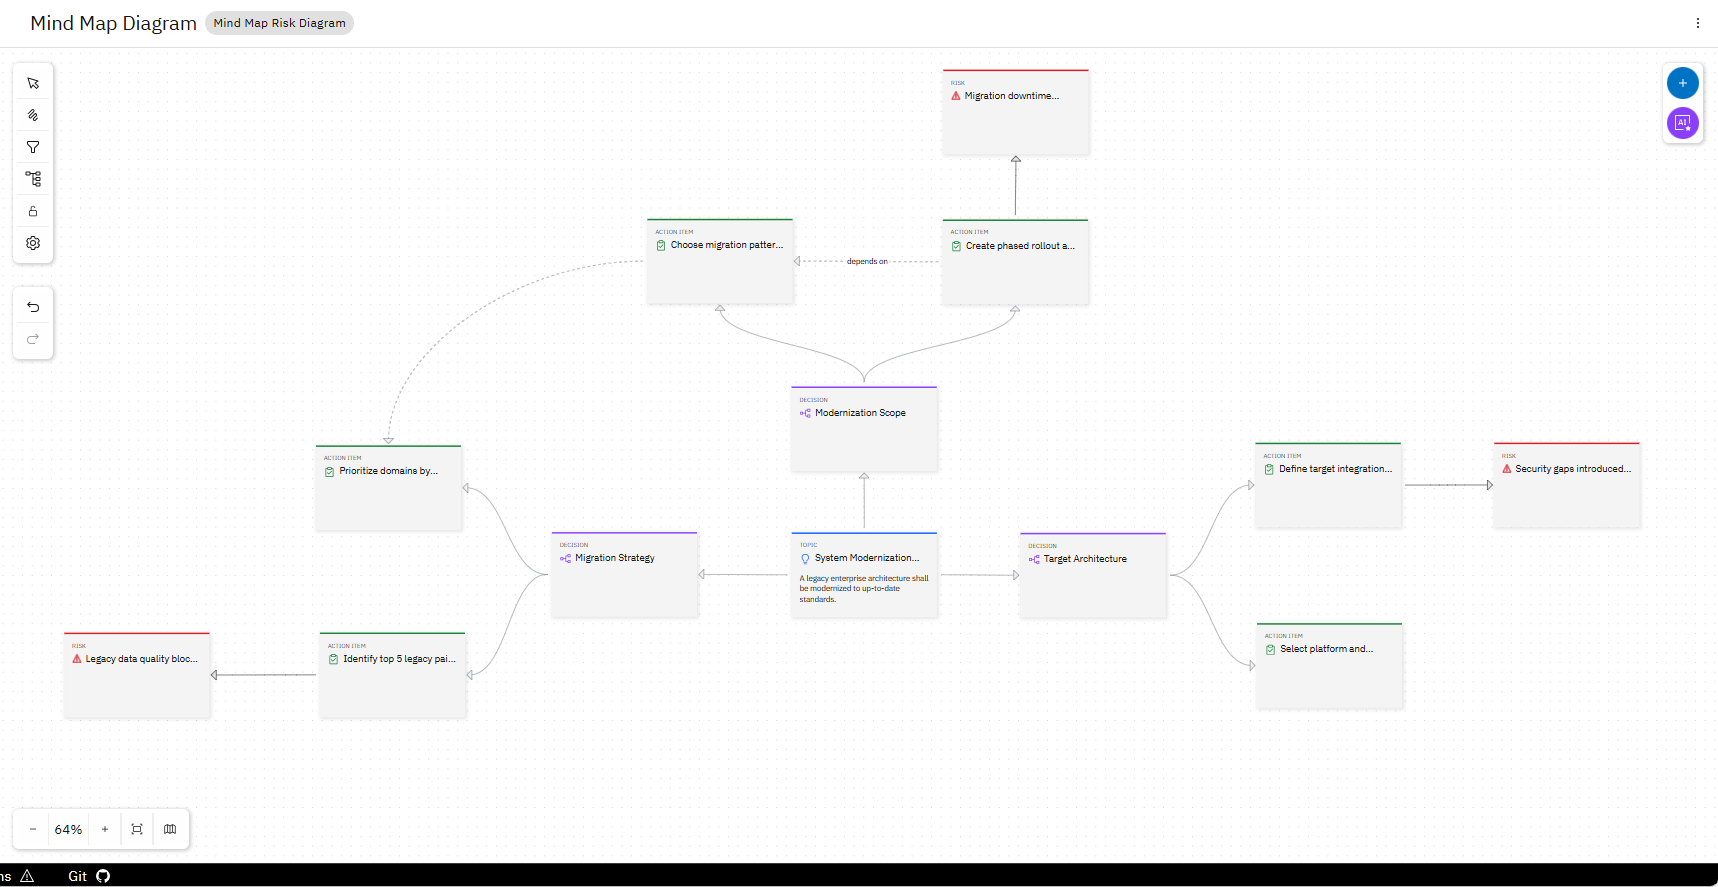
As you can see above, the risk element that comes from another OML profile exists inside the diagram we defined in the mindmap profile. In general, elements and relationships in diagrams are not tied to the OML profile in which they are defined. They are only constraint by the definition of the diagram.
4. How OML profiles affect the Graphical Design
In the following, we will see how the Graphical Design feature of the Workbench is affected by the OML profiles that are enabled in the project.
a) Custom Diagrams
The mindmap profile contains a custom diagram type through this code:
elementTypes:
  ...
  # Diagram Types:
  - id: "mindmap.risk-map-diagram"
    name: "Mind Map Risk Diagram"
    baseType: "diagram"
    canvasConfig:
      allowedElementTypes: ["mindmap.*", "a3.risk"]
      description: "Strict mind map canvas for mindmap elements and risk elements."
    style:
      icon: "Diagram"
      accentColor: "#8a3ffc"
      defaultCanvasStyle: "card"
That has the following effect in the Solution Designer:
The "Mind Map Risk Diagram" is now available in the dropdown of diagram types when creating a new diagram:
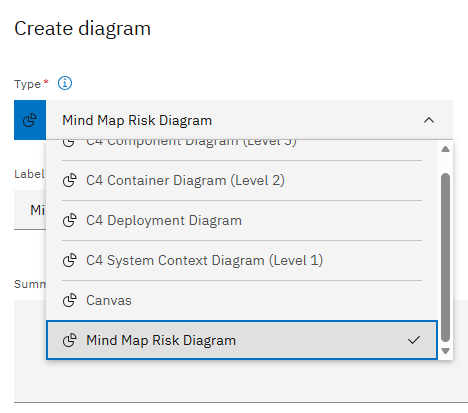
Inside a diagram of this type, you will only find the elements from the mindmap profile and the risk element:
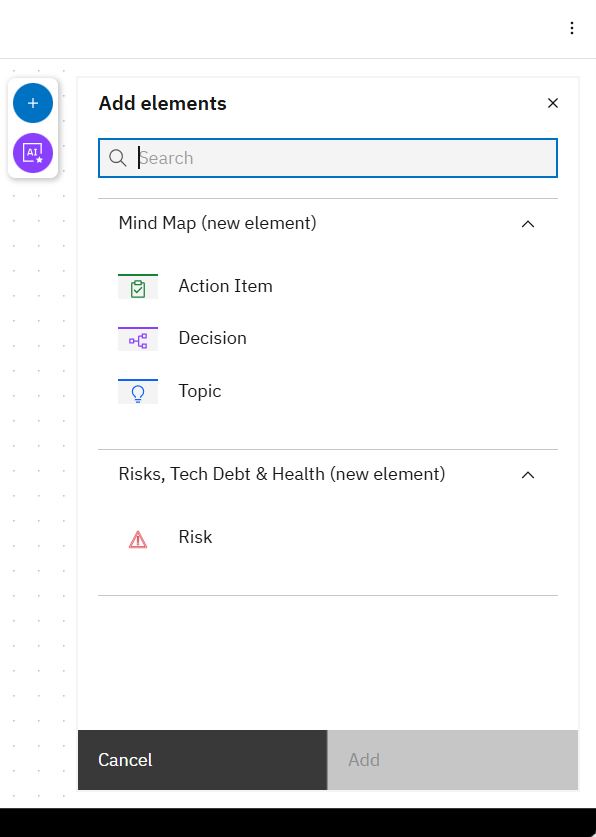
b) Custom Elements
The mindmap profile contains custom model element types through the code on the left side. Then existing model elements are visible in the Solution Designer as a list as shown on the right side and you are able to edit them from here.
elementTypes:
  - id: "mindmap.topic"
    name: "Topic"
    ...
  - id: "mindmap.decision"
    name: "Decision"
    ...
  - id: "mindmap.action-item"
    name: "Action Item"
    ...
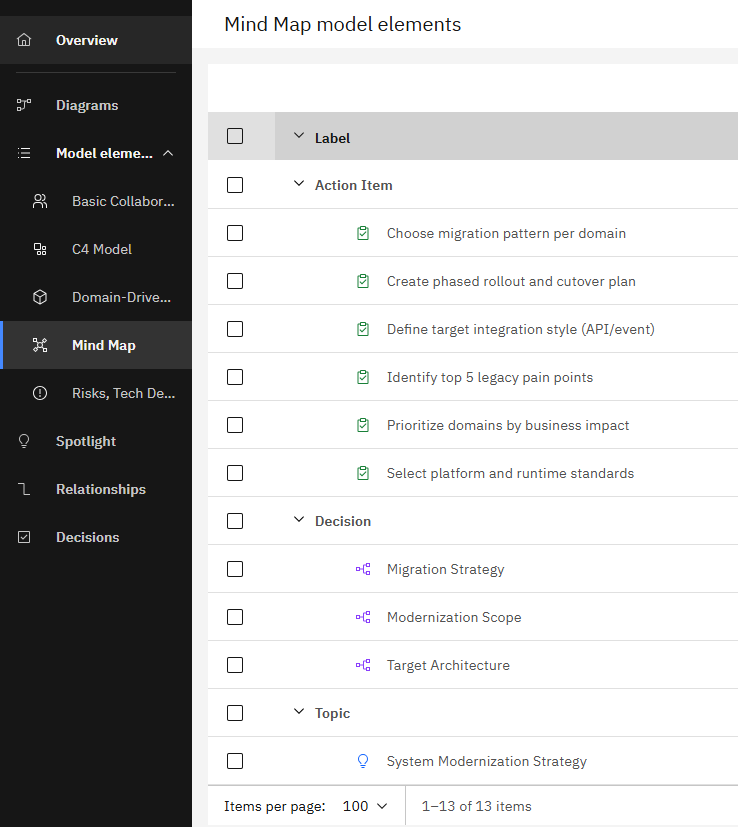
c) Custom Relationships
The mindmap profile contains custom relationship types through the code on the left side. Then existing relationships are visible in the Solution Designer as a list as shown on the right side and you are able to edit them from here.
relationshipTypes:
  - id: "mindmap.branches-to"
    name: "branches to"
    ...
  - id: "mindmap.depends-on"
    name: "depends on"
    ...
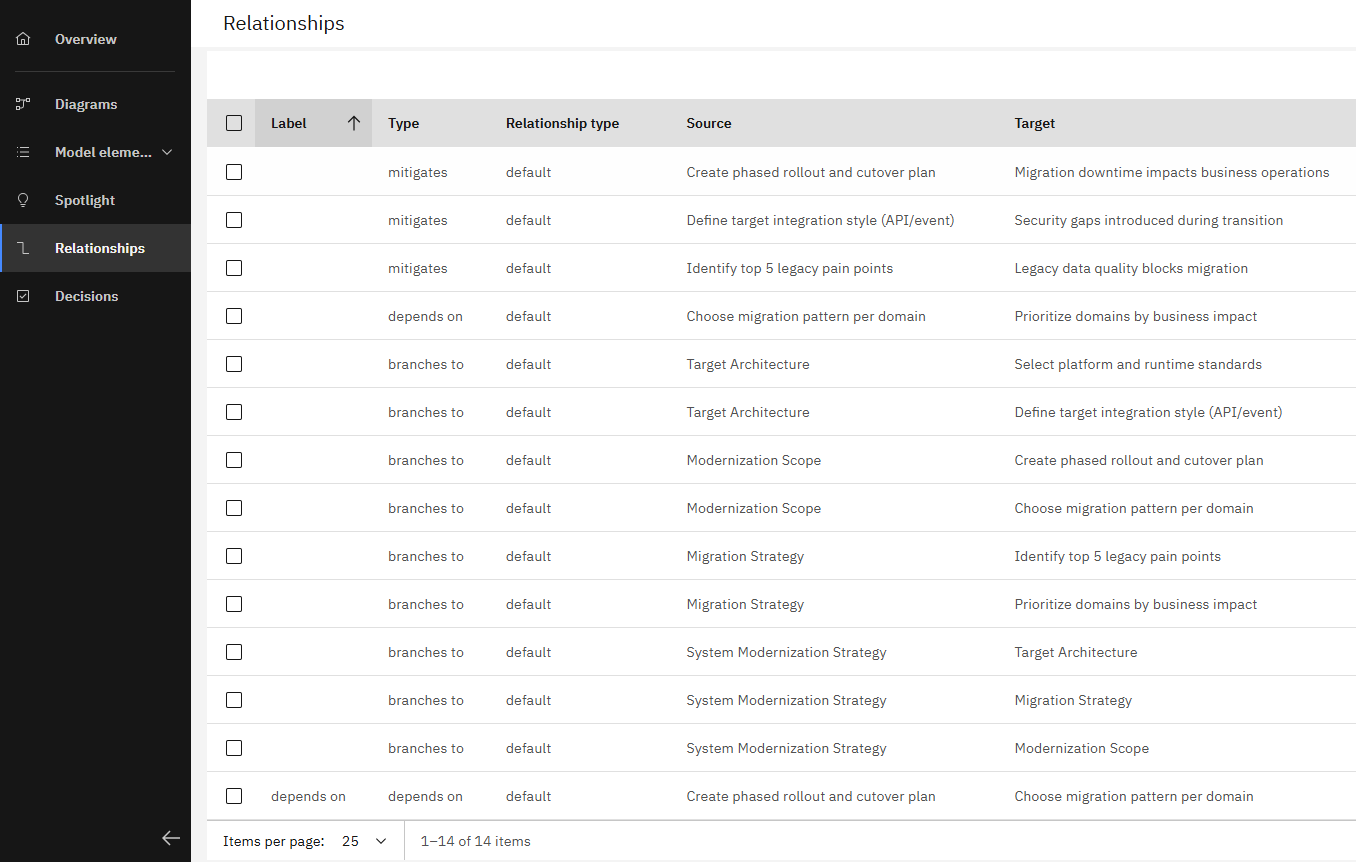
d) Custom Properties
The mindmap profile contains custom properties. In the following, examples are shown for some property types. For each, the code defining the property type is shown on the left side and how it is displayed in the Solution Designer is shown on the right side, when the right sidebar for model element or relationship details is opened.
Property type "text"
Code:
propertyGroups:
  - id: "..."
    ...
    properties:
      - fieldName: "domain"
        displayName: "Domain"
        type: "text"
Display in Solution Designer:

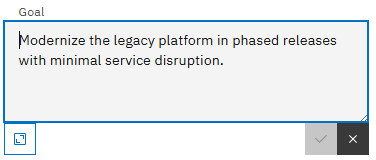
Property type "largeText"
Code:
propertyGroups:
  - id: "..."
    ...
    properties:
      - fieldName: "goal"
        displayName: "Goal"
        type: "largeText"
Display in Solution Designer:
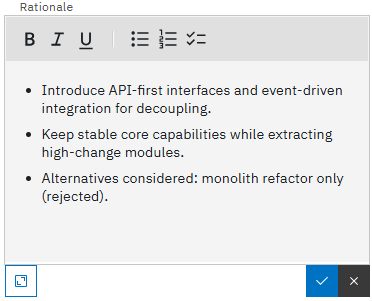
Property type "formattedText"
Code:
propertyGroups:
  - id: "..."
    ...
    properties:
      - fieldName: "rationale"
        displayName: "Rationale"
        type: "formattedText"
Display in Solution Designer:
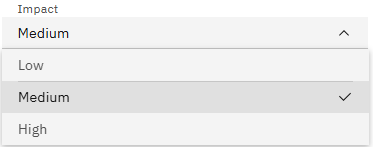
Property type "selection"
Code:
propertyGroups:
  - id: "..."
    ...
    properties:
      - fieldName: "impact"
        displayName: "Impact"
        type: "selection"
        defaultValue: "medium"
        options:
          - key: "low"
            displayName: "Low"
          - key: "medium"
            displayName: "Medium"
          - key: "high"
            displayName: "High"
Display in Solution Designer:
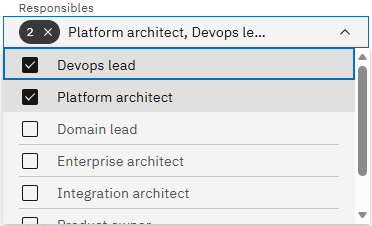
Property type "multipleSelection"
Code:
propertyGroups:
  - id: "..."
      ...
      properties:
        - fieldName: "responsibles"
          displayName: "Responsibles"
          type: "multipleSelection"
          options:
            - key: "enterprise-architect"
              displayName: "Enterprise Architect"
            - key: "integration-architect"
              displayName: "Integration Architect"
            - key: "platform-architect"
              displayName: "Platform Architect"
            - key: "domain-lead"
              displayName: "Domain Lead"
            - key: "devops-lead"
              displayName: "DevOps Lead"
            - key: "product-owner"
              displayName: "Product Owner"
            - key: "program-manager"
              displayName: "Program Manager"
Display in Solution Designer:
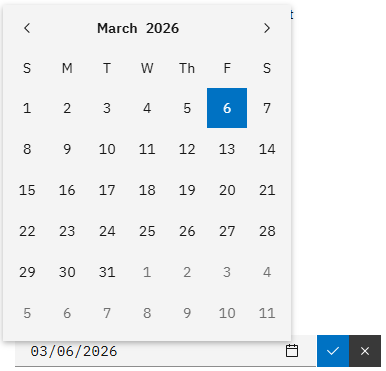
Property type "date"
Code:
propertyGroups:
  - id: "..."
      ...
      properties:
        - fieldName: "due-date"
          displayName: "Due Date"
          type: "date"
Display in Solution Designer:
Property type "rating"
Code:
propertyGroups:
  - id: "..."
      ...
      properties:
        - fieldName: "estimated-complexity"
          displayName: "Estimated Complexity"
          type: "rating"
Display in Solution Designer:

You have used your custom OML profiles and project baselines in the Graphical Design feature of IBM DevOps Solution Workbench. You have seen how a baseline can be used as a starting point for a new project and how the parts you defined in an OML profile are embedded into the Graphical Design feature of the workbench.